Help & Documentation
  • Home
  • Sign In
  • Contact Us
  • Home
  • Sign In
  • Contact Us

Gold Front Month up to 1472.5200

/Futures Technical Analysis - TD/Gold Front Month up to 1472.5200

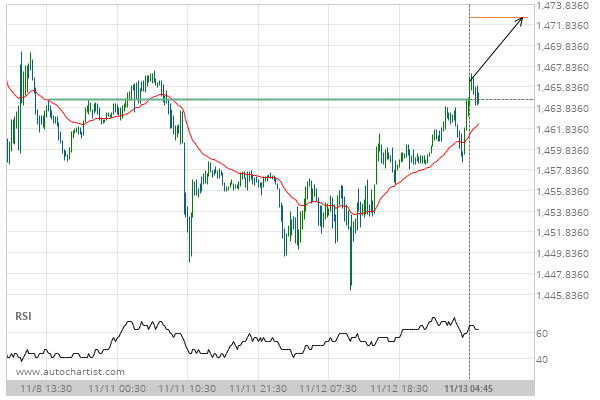
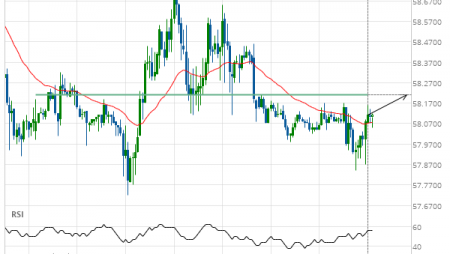
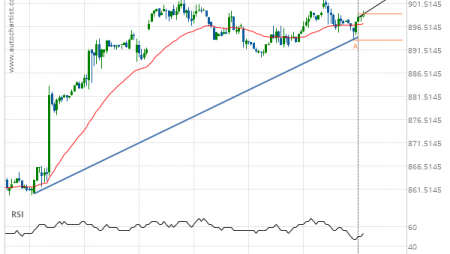
Gold Front Month up to 1472.5200

Posted on November 13, 2019 by Autochartist wrote in Futures Technical Analysis - TD.

Broke through Resistance level of 1464.6000 at 13-Nov-2019 04:45 EST

Tags: GC
0 Likes
570 Views

You may also like

Soybean Oil down to 30.0517
February 13, 2020
Lean Hogs down to 64.4750
January 14, 2021
Gold Front Month up to 1513.6026
September 11, 2019

Comments are closed.

XAG/USD excessive bearish movement KC HRW Wheat down to 418.0000

Futures Technical Analysis – TD

Light Sweet Crude Oil Front Month up to 67.9800

March 9, 2021 11:17 am | By Autochartist

Rising Wedge identified at 09-Mar-2021 05:00 EST. This pattern is... Read more →

Feeder Cattle Front Month down to 137.2250

March 9, 2021 11:17 am | By Autochartist

Channel Down identified at 08-Mar-2021 14:00 EST. This pattern is... Read more →

Soybean Oil up to 53.2300

March 9, 2021 11:17 am | By Autochartist

Channel Up identified at 09-Mar-2021 04:30 EST. This pattern is... Read more →

Silver Front Month up to 26.5600

March 9, 2021 11:17 am | By Autochartist

Approaching Resistance level of 26.5600 identified at 09-Mar-2021 04:00 EST Read more →

10 year T-Note up to 133.1644

March 9, 2021 11:17 am | By Autochartist

Falling Wedge has broken through the resistance line at 09-Mar-2021... Read more →

  • About Us
  • Privacy Policy
  • Disclaimer
  • Terms and Conditions
  • Get started for FREE
  • Contact Us
Copyright © 2020 Autochartist.com. All rights reserved.
This site uses cookies: Find out more.