Help & Documentation
  • Home
  • Sign In
  • Contact Us
  • Home
  • Sign In
  • Contact Us

Gold Front Month up to 1328.6000

/Futures Technical Analysis - TD/Gold Front Month up to 1328.6000

Gold Front Month up to 1328.6000

Posted on February 5, 2019 by admin wrote in Futures Technical Analysis - TD.

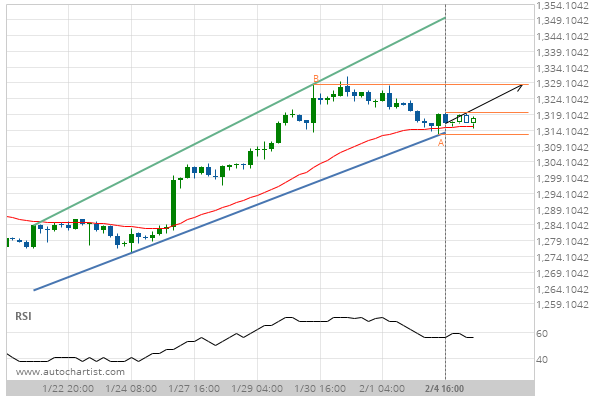
Channel Up identified at 04-Feb-2019 16:00 EST. This pattern is still in the process of forming. Possible bullish price movement towards the resistance 1328.6000 within the next 3 days.

Tags: COMEX, GC
0 Likes
4456 Views

You may also like

Soybean Oil up to 31.9600
November 11, 2019
Lean Hogs up to 61.6522
January 1, 2019
KC HRW Wheat down to 432.2500
July 9, 2019

Comments are closed.

Silver Front Month down to 15.6850 Corn down to 376.5000

Futures Technical Analysis – TD

KC HRW Wheat down to 647.5000

January 19, 2021 11:18 am | By admin

Triangle identified at 19-Jan-2021 06:00 EST. This pattern is still... Read more →

Silver Front Month up to 26.5142

January 19, 2021 11:18 am | By admin

Falling Wedge has broken through the resistance line at 19-Jan-2021... Read more →

Soybean Oil down to 40.6280

January 19, 2021 11:18 am | By admin

Broke through Support level of 41.4800 at 19-Jan-2021 05:00 EST Read more →

Light Sweet Crude Oil Front Month up to 53.1200

January 19, 2021 11:18 am | By admin

Approaching Resistance level of 53.1200 identified at 19-Jan-2021 03:00 EST Read more →

10 year T-Note down to 136.4531

January 19, 2021 11:18 am | By admin

Approaching Support level of 136.4531 identified at 19-Jan-2021 00:00 EST Read more →

  • About Us
  • Privacy Policy
  • Disclaimer
  • Terms and Conditions
  • Get started for FREE
  • Contact Us
Copyright © 2020 Autochartist.com. All rights reserved.
This site uses cookies: Find out more.