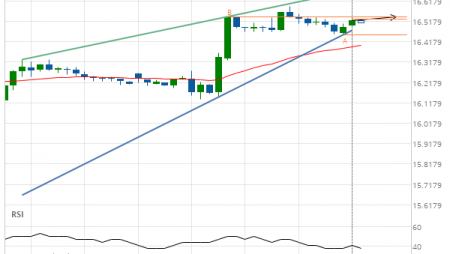
Gold Front Month down to 1818.5444
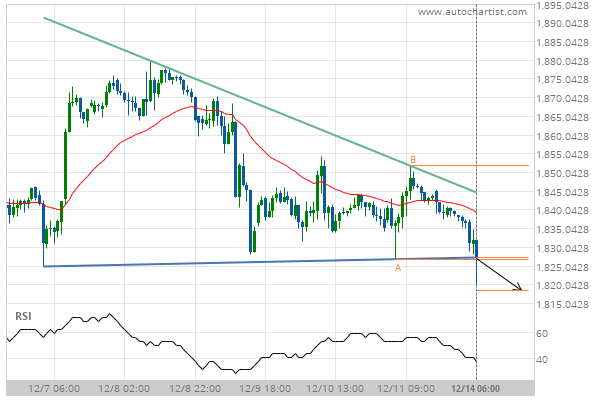
Descending Triangle has broken through the support line at 14-Dec-2020 06:00 EST. Possible bearish price movement forecast for the next 2 days towards 1818.5444.
Descending Triangle has broken through the support line at 14-Dec-2020 06:00 EST. Possible bearish price movement forecast for the next 2 days towards 1818.5444.