Help & Documentation
  • Home
  • Sign In
  • Contact Us
  • Home
  • Sign In
  • Contact Us

Gold Front Month down to 1615.1023

/Futures Technical Analysis - TD/Gold Front Month down to 1615.1023

Gold Front Month down to 1615.1023

Posted on March 12, 2020 by Autochartist wrote in Futures Technical Analysis - TD.

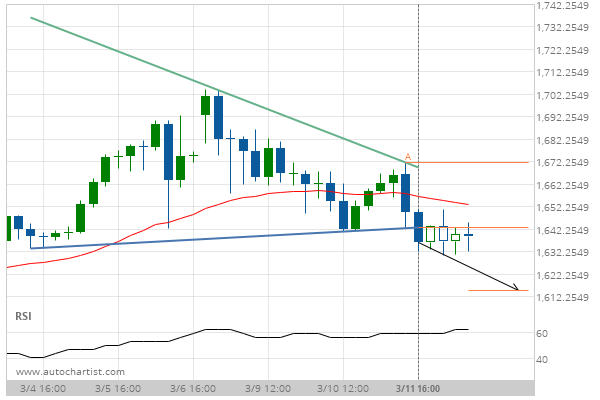
Triangle has broken through the support line at 11-Mar-2020 16:00 EDT. Possible bearish price movement forecast for the next 23 hours towards 1615.1023.

Tags: COMEX, GC
0 Likes
613 Views

You may also like

Feeder Cattle Front Month down to 134.5750
August 9, 2019
Lean Hogs down to 60.2250
December 28, 2018
Soybeans down to 1298.0000
January 28, 2021

Comments are closed.

USD/CAD up to 1.3864 Lean Hogs down to 61.5250

Futures Technical Analysis – TD

Light Sweet Crude Oil Front Month up to 67.9800

March 9, 2021 11:17 am | By Autochartist

Rising Wedge identified at 09-Mar-2021 05:00 EST. This pattern is... Read more →

Feeder Cattle Front Month down to 137.2250

March 9, 2021 11:17 am | By Autochartist

Channel Down identified at 08-Mar-2021 14:00 EST. This pattern is... Read more →

Soybean Oil up to 53.2300

March 9, 2021 11:17 am | By Autochartist

Channel Up identified at 09-Mar-2021 04:30 EST. This pattern is... Read more →

Silver Front Month up to 26.5600

March 9, 2021 11:17 am | By Autochartist

Approaching Resistance level of 26.5600 identified at 09-Mar-2021 04:00 EST Read more →

10 year T-Note up to 133.1644

March 9, 2021 11:17 am | By Autochartist

Falling Wedge has broken through the resistance line at 09-Mar-2021... Read more →

  • About Us
  • Privacy Policy
  • Disclaimer
  • Terms and Conditions
  • Get started for FREE
  • Contact Us
Copyright © 2022 Autochartist.com. All rights reserved.
This site uses cookies: Find out more.