Help & Documentation
  • Home
  • Sign In
  • Contact Us
  • Home
  • Sign In
  • Contact Us

Gold Front Month down to 1501.6000

/Futures Technical Analysis - TD/Gold Front Month down to 1501.6000

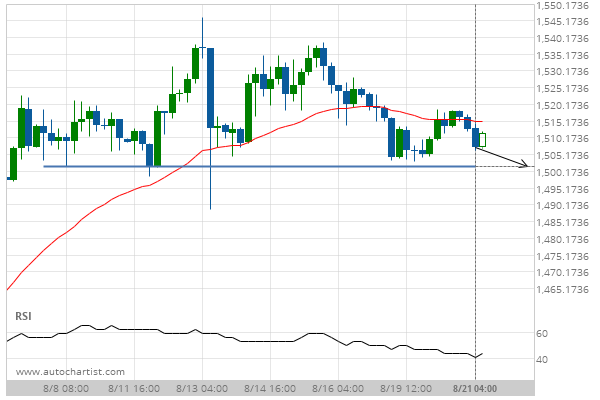
Gold Front Month down to 1501.6000

Posted on August 21, 2019 by Autochartist wrote in Futures Technical Analysis - TD.

Approaching Support level of 1501.6000 identified at 21-Aug-2019 04:00 EDT

Tags: GC
0 Likes
544 Views

You may also like

Corn down to 383.7500
October 7, 2019
KC HRW Wheat up to 489.6500
January 2, 2020
Gold Front Month up to 1862.0300
February 9, 2021

Comments are closed.

American Express Co. (AXP) excessive bearish movement Light Sweet Crude Oil Front Month up to 57.5570

Futures Technical Analysis – TD

Light Sweet Crude Oil Front Month up to 67.9800

March 9, 2021 11:17 am | By Autochartist

Rising Wedge identified at 09-Mar-2021 05:00 EST. This pattern is... Read more →

Feeder Cattle Front Month down to 137.2250

March 9, 2021 11:17 am | By Autochartist

Channel Down identified at 08-Mar-2021 14:00 EST. This pattern is... Read more →

Soybean Oil up to 53.2300

March 9, 2021 11:17 am | By Autochartist

Channel Up identified at 09-Mar-2021 04:30 EST. This pattern is... Read more →

Silver Front Month up to 26.5600

March 9, 2021 11:17 am | By Autochartist

Approaching Resistance level of 26.5600 identified at 09-Mar-2021 04:00 EST Read more →

10 year T-Note up to 133.1644

March 9, 2021 11:17 am | By Autochartist

Falling Wedge has broken through the resistance line at 09-Mar-2021... Read more →

  • About Us
  • Privacy Policy
  • Disclaimer
  • Terms and Conditions
  • Get started for FREE
  • Contact Us
Copyright © 2020 Autochartist.com. All rights reserved.
This site uses cookies: Find out more.