Help & Documentation
  • Home
  • Sign In
  • Contact Us
  • Home
  • Sign In
  • Contact Us

Gold Front Month down to 1496.9393

/Futures Technical Analysis - TD/Gold Front Month down to 1496.9393

Gold Front Month down to 1496.9393

Posted on August 23, 2019 by Autochartist wrote in Futures Technical Analysis - TD.

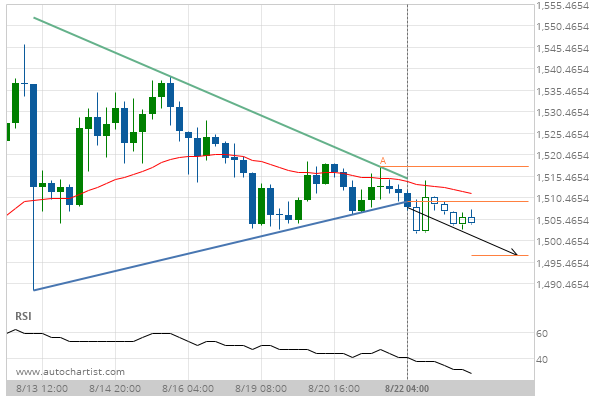
Triangle has broken through the support line at 22-Aug-2019 04:00 EDT. Possible bearish price movement forecast for the next day towards 1496.9393.

Tags: COMEX, GC
0 Likes
583 Views

You may also like

KC HRW Wheat down to 507.5000
January 25, 2019
10 year T-Note up to 132.2454
September 3, 2019
CORN SEPTEMBER 2019 up to 464.5180
June 25, 2019

Comments are closed.

CORN DECEMBER 2019 down to 366.2500 NZD/USD – getting close to resistance of a Channel Down

Futures Technical Analysis – TD

Light Sweet Crude Oil Front Month up to 67.9800

March 9, 2021 11:17 am | By Autochartist

Rising Wedge identified at 09-Mar-2021 05:00 EST. This pattern is... Read more →

Feeder Cattle Front Month down to 137.2250

March 9, 2021 11:17 am | By Autochartist

Channel Down identified at 08-Mar-2021 14:00 EST. This pattern is... Read more →

Soybean Oil up to 53.2300

March 9, 2021 11:17 am | By Autochartist

Channel Up identified at 09-Mar-2021 04:30 EST. This pattern is... Read more →

Silver Front Month up to 26.5600

March 9, 2021 11:17 am | By Autochartist

Approaching Resistance level of 26.5600 identified at 09-Mar-2021 04:00 EST Read more →

10 year T-Note up to 133.1644

March 9, 2021 11:17 am | By Autochartist

Falling Wedge has broken through the resistance line at 09-Mar-2021... Read more →

  • About Us
  • Privacy Policy
  • Disclaimer
  • Terms and Conditions
  • Get started for FREE
  • Contact Us
Copyright © 2020 Autochartist.com. All rights reserved.
This site uses cookies: Find out more.