Help & Documentation
  • Home
  • Sign In
  • Contact Us
  • Home
  • Sign In
  • Contact Us

Gold Front Month down to 1299.6685

/Futures Technical Analysis - TD/Gold Front Month down to 1299.6685

Gold Front Month down to 1299.6685

Posted on February 12, 2019 by admin wrote in Futures Technical Analysis - TD.

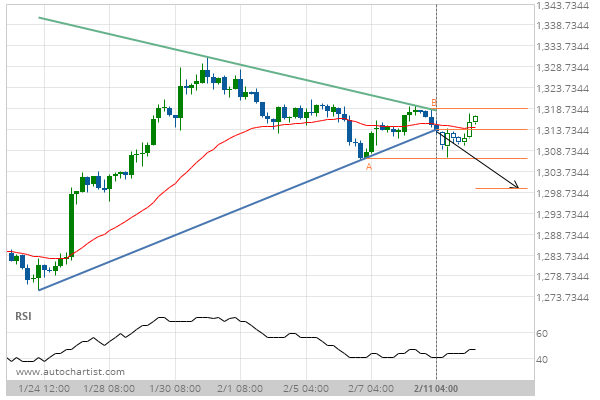
Triangle has broken through the support line at 11-Feb-2019 04:00 EST. Possible bearish price movement forecast for the next 3 days towards 1299.6685.

Tags: COMEX, GC
0 Likes
379 Views

You may also like

Soybeans down to 862.5591
March 9, 2020
Soybeans up to 894.0000
July 9, 2020
Soybean Meal up to 296.4000
April 27, 2020

Comments are closed.

KC HRW Wheat down to 487.5000 Us Treasury Bond March 2019 Target Level: 144.9063

Futures Technical Analysis – TD

KC HRW Wheat down to 647.5000

January 19, 2021 11:18 am | By admin

Triangle identified at 19-Jan-2021 06:00 EST. This pattern is still... Read more →

Silver Front Month up to 26.5142

January 19, 2021 11:18 am | By admin

Falling Wedge has broken through the resistance line at 19-Jan-2021... Read more →

Soybean Oil down to 40.6280

January 19, 2021 11:18 am | By admin

Broke through Support level of 41.4800 at 19-Jan-2021 05:00 EST Read more →

Light Sweet Crude Oil Front Month up to 53.1200

January 19, 2021 11:18 am | By admin

Approaching Resistance level of 53.1200 identified at 19-Jan-2021 03:00 EST Read more →

10 year T-Note down to 136.4531

January 19, 2021 11:18 am | By admin

Approaching Support level of 136.4531 identified at 19-Jan-2021 00:00 EST Read more →

  • About Us
  • Privacy Policy
  • Disclaimer
  • Terms and Conditions
  • Get started for FREE
  • Contact Us
Copyright © 2020 Autochartist.com. All rights reserved.
This site uses cookies: Find out more.