Help & Documentation
  • Home
  • Sign In
  • Contact Us
  • Home
  • Sign In
  • Contact Us

General Electric Co. () up to 6.30

/US Stocks Technical Analysis - TD/General Electric Co. () up to 6.30

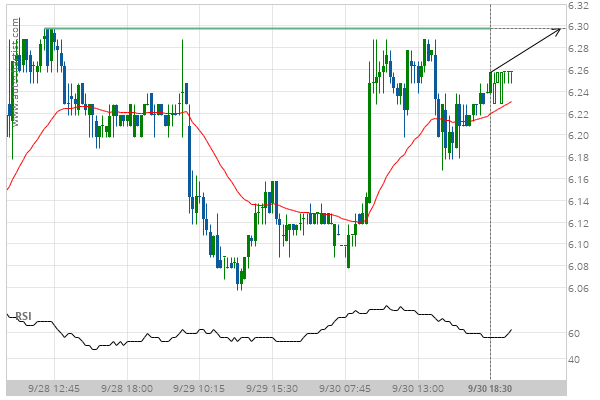
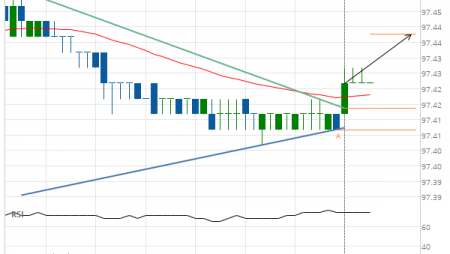
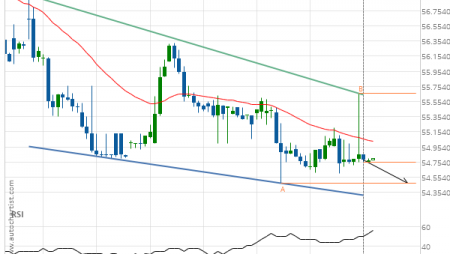
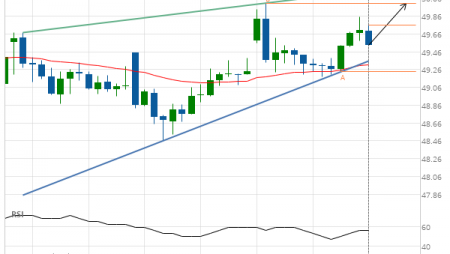
General Electric Co. () up to 6.30

Posted on October 1, 2020 by Autochartist wrote in US Stocks Technical Analysis - TD.

Approaching Resistance level of 6.30 identified at 30-Sep-2020 18:30 EDT

Tags: GE, General Electric Co.
0 Likes
400 Views

You may also like

3m Co. (MMM) up to 171.63
September 3, 2020
Wal-Mart Stores (WMT) down to 95.74
October 22, 2018
Goldman Sachs Group Inc. (GS) down to 190.35
November 30, 2018

Comments are closed.

Verizon Communications Inc. () up to 59.90 US T-Bond down to 175.3368

US Stocks Technical Analysis – TD

Merck & Co. Inc. (MRK) up to 75.56

March 9, 2021 11:13 am | By Autochartist

Rising Wedge identified at 08-Mar-2021 19:30 EST. This pattern is... Read more →

Jpmorgan Chase & Co. (JPM) down to 147.97

March 9, 2021 11:13 am | By Autochartist

Channel Up identified at 08-Mar-2021 19:00 EST. This pattern is... Read more →

Visa (V) down to 215.41

March 9, 2021 11:13 am | By Autochartist

Triangle identified at 08-Mar-2021 20:00 EST. This pattern is still... Read more →

Home Depot Inc. (HD) down to 247.10

March 9, 2021 11:13 am | By Autochartist

Channel Down identified at 08-Mar-2021 16:00 EST. This pattern is... Read more →

Intel Corporation () down to 58.10

March 9, 2021 11:13 am | By Autochartist

Approaching Support level of 58.10 identified at 08-Mar-2021 16:00 EST Read more →

  • About Us
  • Privacy Policy
  • Disclaimer
  • Terms and Conditions
  • Get started for FREE
  • Contact Us
Copyright © 2022 Autochartist.com. All rights reserved.
This site uses cookies: Find out more.