Help & Documentation
  • Home
  • Sign In
  • Contact Us
  • Home
  • Sign In
  • Contact Us

General Electric Co. () down to 10.45

/US Stocks Technical Analysis - TD/General Electric Co. () down to 10.45

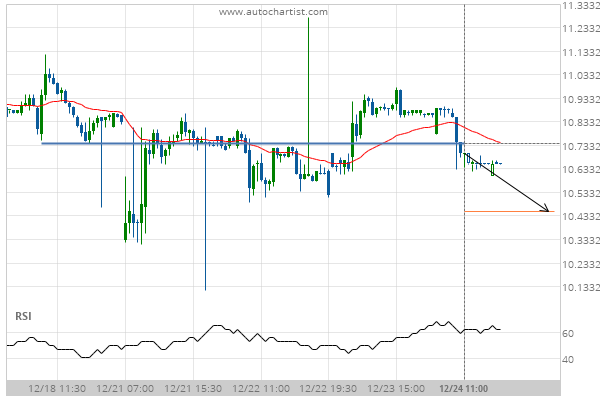
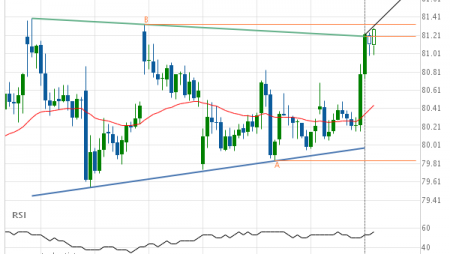
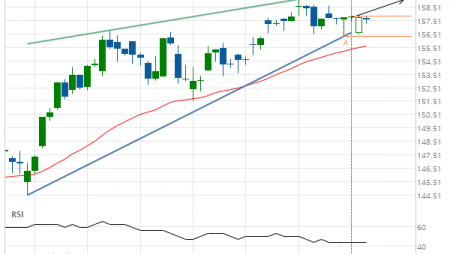
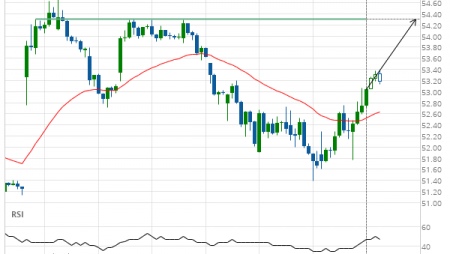
General Electric Co. () down to 10.45

Posted on December 25, 2020 by Autochartist wrote in US Stocks Technical Analysis - TD.

Broke through Support level of 10.74 at 24-Dec-2020 11:00 EST

Tags: GE, General Electric Co.
0 Likes
364 Views

You may also like

3m Co. (MMM) down to 169.25
December 8, 2020
American Express Co. (AXP) up to 108.63
November 12, 2018
Exxon Mobil Corp. (XOM) up to 44.80
January 12, 2021

Comments are closed.

Trade of the Day: AUD/USD Merck & Co. Inc. (MRK) up to 80.43

US Stocks Technical Analysis – TD

Merck & Co. Inc. (MRK) up to 75.56

March 9, 2021 11:13 am | By Autochartist

Rising Wedge identified at 08-Mar-2021 19:30 EST. This pattern is... Read more →

Visa (V) down to 215.41

March 9, 2021 11:13 am | By Autochartist

Triangle identified at 08-Mar-2021 20:00 EST. This pattern is still... Read more →

Jpmorgan Chase & Co. (JPM) down to 147.97

March 9, 2021 11:13 am | By Autochartist

Channel Up identified at 08-Mar-2021 19:00 EST. This pattern is... Read more →

Home Depot Inc. (HD) down to 247.10

March 9, 2021 11:13 am | By Autochartist

Channel Down identified at 08-Mar-2021 16:00 EST. This pattern is... Read more →

Intel Corporation () down to 58.10

March 9, 2021 11:13 am | By Autochartist

Approaching Support level of 58.10 identified at 08-Mar-2021 16:00 EST Read more →

  • About Us
  • Privacy Policy
  • Disclaimer
  • Terms and Conditions
  • Get started for FREE
  • Contact Us
Copyright © 2022 Autochartist.com. All rights reserved.
This site uses cookies: Find out more.