Help & Documentation
  • Home
  • Sign In
  • Contact Us
  • Home
  • Sign In
  • Contact Us

GBP/CAD up to 1.6194

/Forex Technical Analysis - TD/GBP/CAD up to 1.6194

GBP/CAD up to 1.6194

Posted on August 20, 2019 by Autochartist wrote in Forex Technical Analysis - TD.

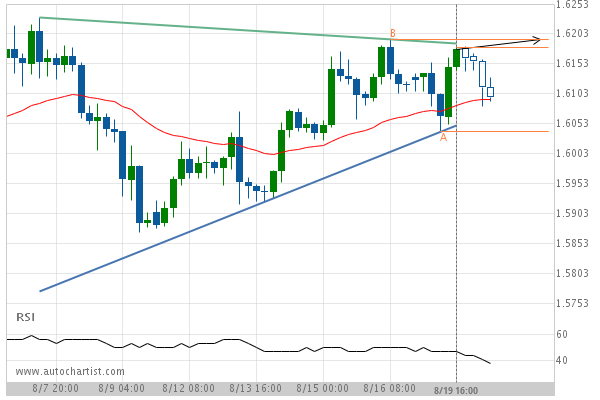
Triangle identified at 19-Aug-2019 16:00 EDT. This pattern is still in the process of forming. Possible bullish price movement towards the resistance 1.6194 within the next 2 days.

Tags: GBPCAD
0 Likes
687 Views

You may also like

USD/JPY up to 110.9930
March 23, 2020
GBP/USD down to 1.3016
March 10, 2020
XAG/USD up to 14.8400
October 25, 2018

Comments are closed.

NZD/USD down to 0.6399 USD/CAD up to 1.3342

Forex Technical Analysis – TD

EUR/CHF up to 1.1152

March 9, 2021 11:15 am | By Autochartist

Rising Wedge identified at 09-Mar-2021 00:00 EST. This pattern is... Read more →

EUR/JPY up to 129.6360

March 9, 2021 11:15 am | By Autochartist

Triangle identified at 08-Mar-2021 20:00 EST. This pattern is still... Read more →

NZD/USD up to 0.7188

March 9, 2021 11:15 am | By Autochartist

Broke through Resistance level of 0.7153 at 09-Mar-2021 04:00 EST Read more →

USD/JPY down to 108.1606

March 9, 2021 11:15 am | By Autochartist

Rising Wedge has broken through the support line at 09-Mar-2021... Read more →

USD/CHF down to 0.9284

March 9, 2021 11:15 am | By Autochartist

Approaching Support level of 0.9284 identified at 09-Mar-2021 05:15 EST Read more →

  • About Us
  • Privacy Policy
  • Disclaimer
  • Terms and Conditions
  • Get started for FREE
  • Contact Us
Copyright © 2022 Autochartist.com. All rights reserved.
This site uses cookies: Find out more.