Help & Documentation
  • Home
  • Sign In
  • Contact Us
  • Home
  • Sign In
  • Contact Us

Exxon Mobil Corp. () up to 65.04

/US Stocks Technical Analysis - TD/Exxon Mobil Corp. () up to 65.04

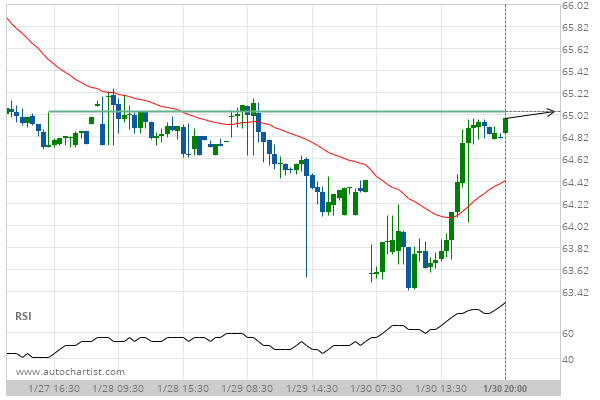
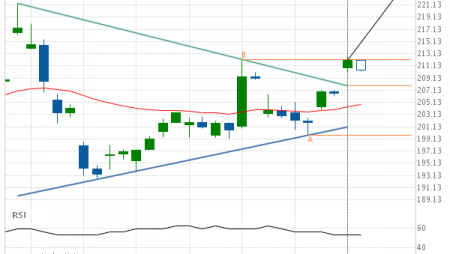
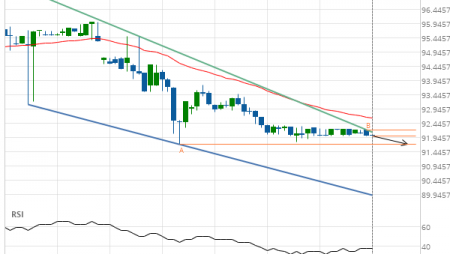
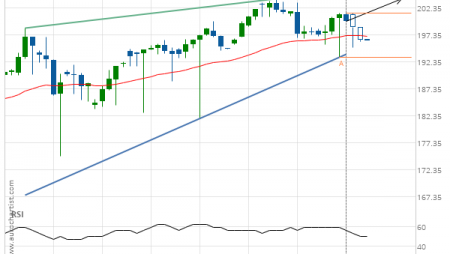
Exxon Mobil Corp. () up to 65.04

Posted on January 31, 2020 by Autochartist wrote in US Stocks Technical Analysis - TD.

Approaching Resistance level of 65.04 identified at 30-Jan-2020 20:00 EST

Tags: Exxon Mobil Corp., XOM
0 Likes
673 Views

You may also like

General Electric Co. () up to 12.93
February 24, 2021
Microsoft Corporation () down to 169.81
May 14, 2020
Verizon Communications Inc. (VZ) down to 54.25
June 23, 2020

Comments are closed.

Caterpillar Inc. (CAT) up to 139.73 Wal-Mart Stores () up to 117.12

US Stocks Technical Analysis – TD

Merck & Co. Inc. (MRK) up to 75.56

March 9, 2021 11:13 am | By Autochartist

Rising Wedge identified at 08-Mar-2021 19:30 EST. This pattern is... Read more →

Jpmorgan Chase & Co. (JPM) down to 147.97

March 9, 2021 11:13 am | By Autochartist

Channel Up identified at 08-Mar-2021 19:00 EST. This pattern is... Read more →

Visa (V) down to 215.41

March 9, 2021 11:13 am | By Autochartist

Triangle identified at 08-Mar-2021 20:00 EST. This pattern is still... Read more →

Home Depot Inc. (HD) down to 247.10

March 9, 2021 11:13 am | By Autochartist

Channel Down identified at 08-Mar-2021 16:00 EST. This pattern is... Read more →

Intel Corporation () down to 58.10

March 9, 2021 11:13 am | By Autochartist

Approaching Support level of 58.10 identified at 08-Mar-2021 16:00 EST Read more →

  • About Us
  • Privacy Policy
  • Disclaimer
  • Terms and Conditions
  • Get started for FREE
  • Contact Us
Copyright © 2022 Autochartist.com. All rights reserved.
This site uses cookies: Find out more.