Help & Documentation
  • Home
  • Sign In
  • Contact Us
  • Home
  • Sign In
  • Contact Us

Exxon Mobil Corp. () down to 40.98

/US Stocks Technical Analysis - TD/Exxon Mobil Corp. () down to 40.98

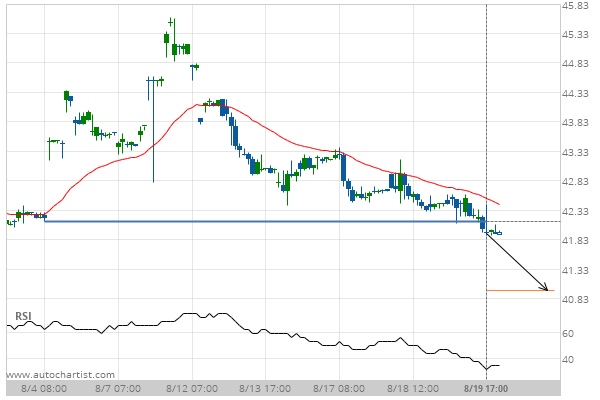
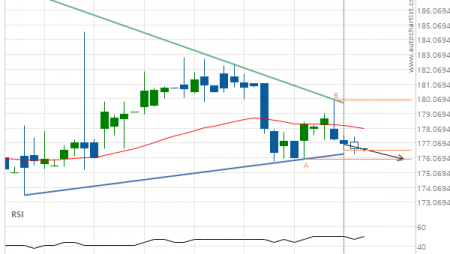
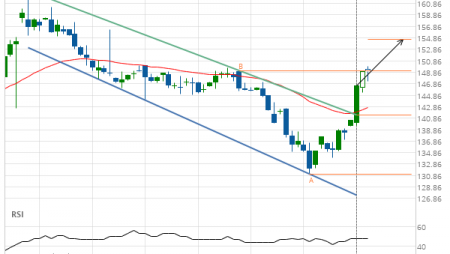
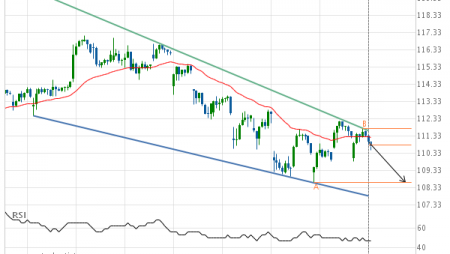
Exxon Mobil Corp. () down to 40.98

Posted on August 20, 2020 by Autochartist wrote in US Stocks Technical Analysis - TD.

Broke through Support level of 42.15 at 19-Aug-2020 17:00 EDT

Tags: Exxon Mobil Corp., XOM
0 Likes
464 Views

You may also like

Mcdonalds Corp. (MCD) up to 166.77
October 17, 2018
Eurodollar (GE) down to 97.24
November 21, 2018
Goldman Sachs Group Inc. (GS) up to 213.71
July 20, 2020

Comments are closed.

Corn excessive bearish movement Wal-Mart Stores () down to 131.35

US Stocks Technical Analysis – TD

Merck & Co. Inc. (MRK) up to 75.56

March 9, 2021 11:13 am | By Autochartist

Rising Wedge identified at 08-Mar-2021 19:30 EST. This pattern is... Read more →

Jpmorgan Chase & Co. (JPM) down to 147.97

March 9, 2021 11:13 am | By Autochartist

Channel Up identified at 08-Mar-2021 19:00 EST. This pattern is... Read more →

Visa (V) down to 215.41

March 9, 2021 11:13 am | By Autochartist

Triangle identified at 08-Mar-2021 20:00 EST. This pattern is still... Read more →

Home Depot Inc. (HD) down to 247.10

March 9, 2021 11:13 am | By Autochartist

Channel Down identified at 08-Mar-2021 16:00 EST. This pattern is... Read more →

Intel Corporation () down to 58.10

March 9, 2021 11:13 am | By Autochartist

Approaching Support level of 58.10 identified at 08-Mar-2021 16:00 EST Read more →

  • About Us
  • Privacy Policy
  • Disclaimer
  • Terms and Conditions
  • Get started for FREE
  • Contact Us
Copyright © 2022 Autochartist.com. All rights reserved.
This site uses cookies: Find out more.