Help & Documentation
  • Home
  • Sign In
  • Contact Us
  • Home
  • Sign In
  • Contact Us

E-mini S&P 500 up to 3360.6001

/Futures Technical Analysis - TD/E-mini S&P 500 up to 3360.6001

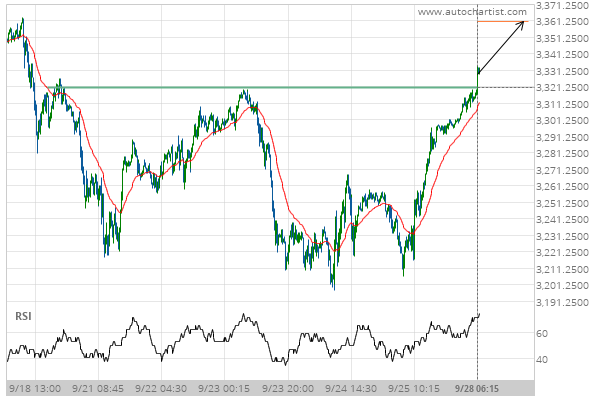
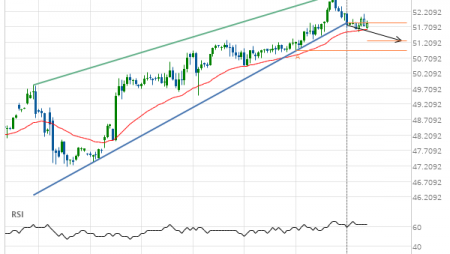
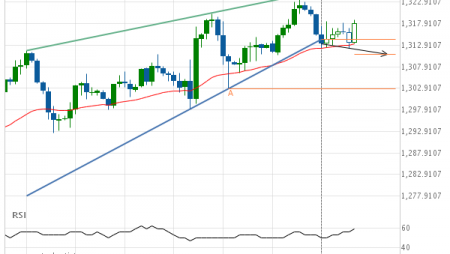
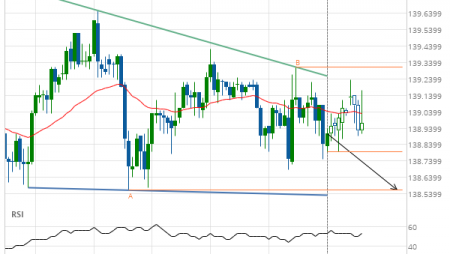
E-mini S&P 500 up to 3360.6001

Posted on September 28, 2020 by Autochartist wrote in Futures Technical Analysis - TD.

Broke through Resistance level of 3320.5000 at 28-Sep-2020 06:15 EDT

Tags: ES
0 Likes
411 Views

You may also like

E-mini S&P 500 up to 3004.9738
May 25, 2020
Gold Front Month down to 1885.0000
October 20, 2020
10 year T-Note up to 137.3440
January 7, 2021

Comments are closed.

Gold Front Month down to 1836.6125 Soybeans down to 997.2500

Futures Technical Analysis – TD

Light Sweet Crude Oil Front Month up to 67.9800

March 9, 2021 11:17 am | By Autochartist

Rising Wedge identified at 09-Mar-2021 05:00 EST. This pattern is... Read more →

Feeder Cattle Front Month down to 137.2250

March 9, 2021 11:17 am | By Autochartist

Channel Down identified at 08-Mar-2021 14:00 EST. This pattern is... Read more →

Soybean Oil up to 53.2300

March 9, 2021 11:17 am | By Autochartist

Channel Up identified at 09-Mar-2021 04:30 EST. This pattern is... Read more →

Silver Front Month up to 26.5600

March 9, 2021 11:17 am | By Autochartist

Approaching Resistance level of 26.5600 identified at 09-Mar-2021 04:00 EST Read more →

10 year T-Note up to 133.1644

March 9, 2021 11:17 am | By Autochartist

Falling Wedge has broken through the resistance line at 09-Mar-2021... Read more →

  • About Us
  • Privacy Policy
  • Disclaimer
  • Terms and Conditions
  • Get started for FREE
  • Contact Us
Copyright © 2022 Autochartist.com. All rights reserved.
This site uses cookies: Find out more.