Help & Documentation
  • Home
  • Sign In
  • Contact Us
  • Home
  • Sign In
  • Contact Us

E-mini S&P 500 up to 3092.6703

/Futures Technical Analysis - TD/E-mini S&P 500 up to 3092.6703

E-mini S&P 500 up to 3092.6703

Posted on November 7, 2019 by Autochartist wrote in Futures Technical Analysis - TD.

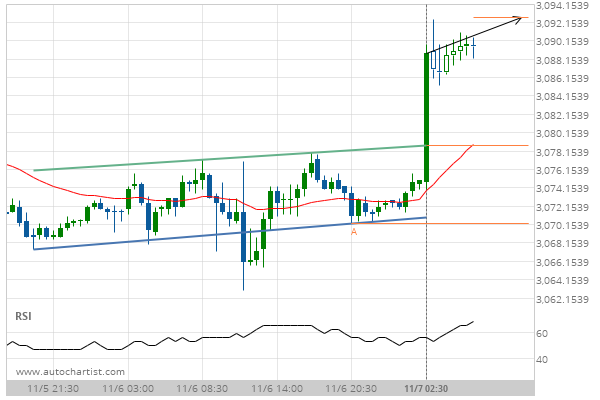
Inverse Head and Shoulders has broken through the resistance line at 07-Nov-2019 02:30 EST. Possible bullish price movement forecast for the next 6 hours towards 3092.6703.

Tags: CME, ES
0 Likes
616 Views

You may also like

Silver Front Month up to 26.5142
January 19, 2021
Soybean Meal up to 303.1000
December 16, 2019
Lean Hogs down to 66.8638
January 6, 2020

Comments are closed.

KC HRW Wheat up to 432.2500 Will GBP/USD have enough momentum to break resistance?

Futures Technical Analysis – TD

Light Sweet Crude Oil Front Month up to 67.9800

March 9, 2021 11:17 am | By Autochartist

Rising Wedge identified at 09-Mar-2021 05:00 EST. This pattern is... Read more →

Feeder Cattle Front Month down to 137.2250

March 9, 2021 11:17 am | By Autochartist

Channel Down identified at 08-Mar-2021 14:00 EST. This pattern is... Read more →

Soybean Oil up to 53.2300

March 9, 2021 11:17 am | By Autochartist

Channel Up identified at 09-Mar-2021 04:30 EST. This pattern is... Read more →

Silver Front Month up to 26.5600

March 9, 2021 11:17 am | By Autochartist

Approaching Resistance level of 26.5600 identified at 09-Mar-2021 04:00 EST Read more →

10 year T-Note up to 133.1644

March 9, 2021 11:17 am | By Autochartist

Falling Wedge has broken through the resistance line at 09-Mar-2021... Read more →

  • About Us
  • Privacy Policy
  • Disclaimer
  • Terms and Conditions
  • Get started for FREE
  • Contact Us
Copyright © 2020 Autochartist.com. All rights reserved.
This site uses cookies: Find out more.