Help & Documentation
  • Home
  • Sign In
  • Contact Us
  • Home
  • Sign In
  • Contact Us

E-mini S&P 500 up to 2964.5000

/Futures Technical Analysis - TD/E-mini S&P 500 up to 2964.5000

E-mini S&P 500 up to 2964.5000

Posted on June 24, 2019 by Autochartist wrote in Futures Technical Analysis - TD.

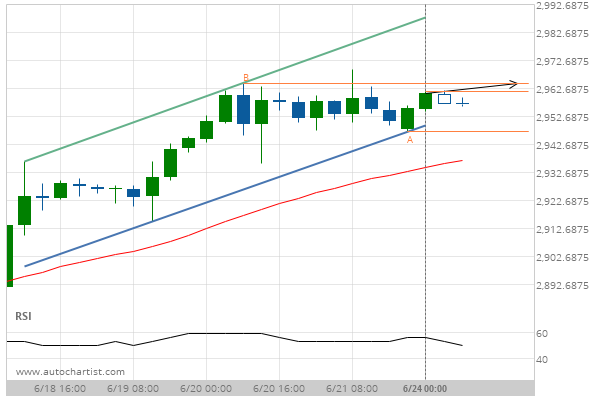
Channel Up identified at 24-Jun-2019 00:00 EDT. This pattern is still in the process of forming. Possible bullish price movement towards the resistance 2964.5000 within the next 19 hours.

Tags: CME, ES
0 Likes
708 Views

You may also like

US T-Bond up to 169.4625
January 25, 2021
Lean Hogs up to 66.9500
May 15, 2020
Corn down to 314.5000
August 3, 2020

Comments are closed.

Walt Disney (DIS) down to 138.15 Light Sweet Crude Oil Front Month up to 58.2200

Futures Technical Analysis – TD

Light Sweet Crude Oil Front Month up to 67.9800

March 9, 2021 11:17 am | By Autochartist

Rising Wedge identified at 09-Mar-2021 05:00 EST. This pattern is... Read more →

Feeder Cattle Front Month down to 137.2250

March 9, 2021 11:17 am | By Autochartist

Channel Down identified at 08-Mar-2021 14:00 EST. This pattern is... Read more →

Soybean Oil up to 53.2300

March 9, 2021 11:17 am | By Autochartist

Channel Up identified at 09-Mar-2021 04:30 EST. This pattern is... Read more →

Silver Front Month up to 26.5600

March 9, 2021 11:17 am | By Autochartist

Approaching Resistance level of 26.5600 identified at 09-Mar-2021 04:00 EST Read more →

10 year T-Note up to 133.1644

March 9, 2021 11:17 am | By Autochartist

Falling Wedge has broken through the resistance line at 09-Mar-2021... Read more →

  • About Us
  • Privacy Policy
  • Disclaimer
  • Terms and Conditions
  • Get started for FREE
  • Contact Us
Copyright © 2022 Autochartist.com. All rights reserved.
This site uses cookies: Find out more.