Help & Documentation
  • Home
  • Sign In
  • Contact Us
  • Home
  • Sign In
  • Contact Us

E-mini S&P 500 up to 2542.2749

/Futures Technical Analysis - TD/E-mini S&P 500 up to 2542.2749

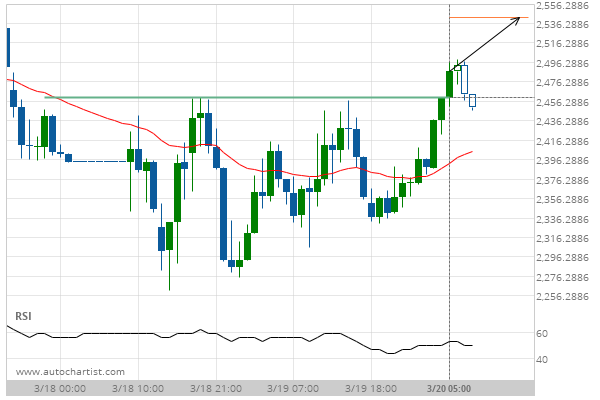
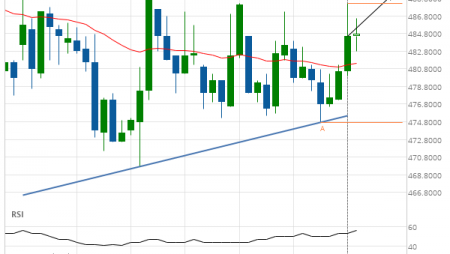
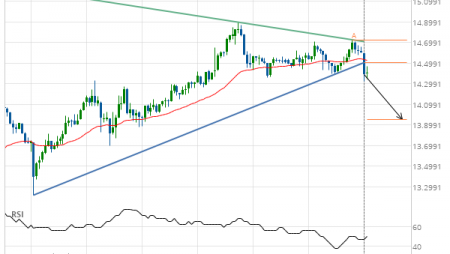
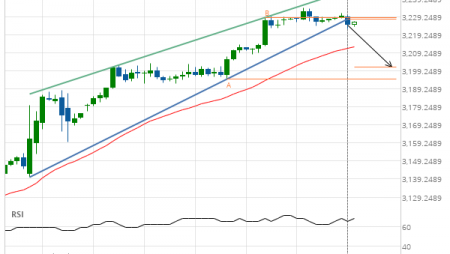
E-mini S&P 500 up to 2542.2749

Posted on March 20, 2020 by Autochartist wrote in Futures Technical Analysis - TD.

Broke through Resistance level of 2460.0000 at 20-Mar-2020 05:00 EDT

Tags: ES
0 Likes
746 Views

You may also like

Soybean Oil down to 43.7960
February 1, 2021
Light Sweet Crude Oil Front Month down to 20.3296
April 10, 2020
Soybeans up to 1427.6250
February 9, 2021

Comments are closed.

For Better Results try a Dual Stochastic Forex Strategy Corn up to 356.2500

Futures Technical Analysis – TD

Light Sweet Crude Oil Front Month up to 67.9800

March 9, 2021 11:17 am | By Autochartist

Rising Wedge identified at 09-Mar-2021 05:00 EST. This pattern is... Read more →

Feeder Cattle Front Month down to 137.2250

March 9, 2021 11:17 am | By Autochartist

Channel Down identified at 08-Mar-2021 14:00 EST. This pattern is... Read more →

Soybean Oil up to 53.2300

March 9, 2021 11:17 am | By Autochartist

Channel Up identified at 09-Mar-2021 04:30 EST. This pattern is... Read more →

Silver Front Month up to 26.5600

March 9, 2021 11:17 am | By Autochartist

Approaching Resistance level of 26.5600 identified at 09-Mar-2021 04:00 EST Read more →

10 year T-Note up to 133.1644

March 9, 2021 11:17 am | By Autochartist

Falling Wedge has broken through the resistance line at 09-Mar-2021... Read more →

  • About Us
  • Privacy Policy
  • Disclaimer
  • Terms and Conditions
  • Get started for FREE
  • Contact Us
Copyright © 2022 Autochartist.com. All rights reserved.
This site uses cookies: Find out more.