Help & Documentation
  • Home
  • Sign In
  • Contact Us
  • Home
  • Sign In
  • Contact Us

E-mini S&P 500 up to 2364.1935

/Futures Technical Analysis - TD/E-mini S&P 500 up to 2364.1935

E-mini S&P 500 up to 2364.1935

Posted on December 26, 2018 by Autochartist wrote in Futures Technical Analysis - TD.

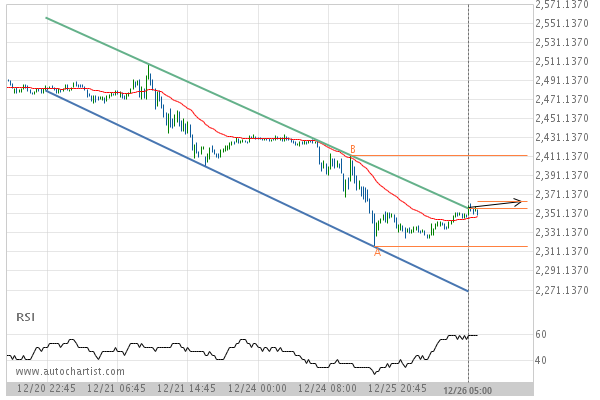
Channel Down has broken through the resistance line at 26-Dec-2018 05:00 EST. Possible bullish price movement forecast for the next 15 hours towards 2364.1935.

Tags: CME, ES
0 Likes
756 Views

You may also like

Gold Front Month up to 1522.7000
August 9, 2019
Feeder Cattle Front Month up to 143.4500
June 7, 2019
Corn down to 340.0360
July 7, 2020

Comments are closed.

US T-Bond up to 146.0938 Light Sweet Crude Oil Front Month excessive bearish movement

Futures Technical Analysis – TD

Light Sweet Crude Oil Front Month up to 67.9800

March 9, 2021 11:17 am | By Autochartist

Rising Wedge identified at 09-Mar-2021 05:00 EST. This pattern is... Read more →

Feeder Cattle Front Month down to 137.2250

March 9, 2021 11:17 am | By Autochartist

Channel Down identified at 08-Mar-2021 14:00 EST. This pattern is... Read more →

Soybean Oil up to 53.2300

March 9, 2021 11:17 am | By Autochartist

Channel Up identified at 09-Mar-2021 04:30 EST. This pattern is... Read more →

Silver Front Month up to 26.5600

March 9, 2021 11:17 am | By Autochartist

Approaching Resistance level of 26.5600 identified at 09-Mar-2021 04:00 EST Read more →

10 year T-Note up to 133.1644

March 9, 2021 11:17 am | By Autochartist

Falling Wedge has broken through the resistance line at 09-Mar-2021... Read more →

  • About Us
  • Privacy Policy
  • Disclaimer
  • Terms and Conditions
  • Get started for FREE
  • Contact Us
Copyright © 2020 Autochartist.com. All rights reserved.
This site uses cookies: Find out more.