Help & Documentation
  • Home
  • Sign In
  • Contact Us
  • Home
  • Sign In
  • Contact Us

E-mini S&P 500 excessive bearish movement

/Futures Statistical Analysis - TD/E-mini S&P 500 excessive bearish movement

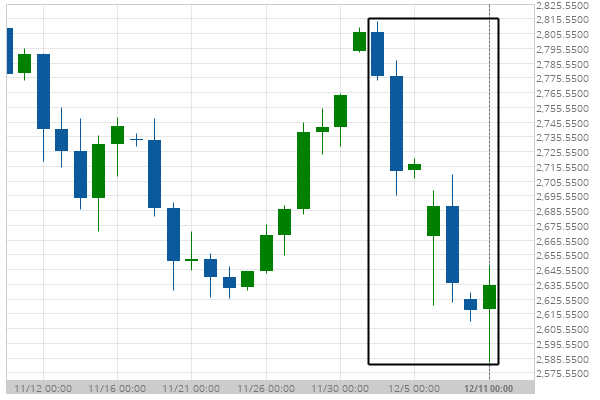
E-mini S&P 500 excessive bearish movement

Posted on December 11, 2018 by Autochartist wrote in Futures Statistical Analysis - TD.

E-mini S&P 500 experienced a 6.1% bearish movement in the last 8 days.

Tags: Big Movement, ES
0 Likes
821 Views

You may also like

10 year T-Note excessive bearish movement
June 4, 2019
Lean Hogs excessive bearish movement
November 29, 2018
Lean Hogs excessive bearish movement
April 24, 2020

Comments are closed.

Silver Front Month excessive bearish movement USD/CAD up to 1.3444

Futures Statistical Analysis – TD

Soybean Oil excessive bearish movement

March 9, 2021 11:16 am | By Autochartist

Soybean Oil experienced a 19.04% bullish movement in the last... Read more →

Corn excessive bearish movement

March 8, 2021 11:19 am | By Autochartist

Corn experienced a 4.61% bullish movement in the last 73... Read more →

Gold Front Month excessive bearish movement

March 8, 2021 11:19 am | By Autochartist

Gold Front Month experienced a 6.29% bearish movement in the... Read more →

Light Sweet Crude Oil Front Month excessive bearish movement

March 8, 2021 11:19 am | By Autochartist

Light Sweet Crude Oil Front Month experienced a 8.6% bullish... Read more →

US T-Bond excessive bearish movement

March 8, 2021 11:19 am | By Autochartist

US T-Bond experienced a 7.75% bearish movement in the last... Read more →

  • About Us
  • Privacy Policy
  • Disclaimer
  • Terms and Conditions
  • Get started for FREE
  • Contact Us
Copyright © 2020 Autochartist.com. All rights reserved.
This site uses cookies: Find out more.