Help & Documentation
  • Home
  • Sign In
  • Contact Us
  • Home
  • Sign In
  • Contact Us

E-mini S&P 500 down to 3001.4746

/Futures Technical Analysis - TD/E-mini S&P 500 down to 3001.4746

E-mini S&P 500 down to 3001.4746

Posted on September 20, 2019 by Autochartist wrote in Futures Technical Analysis - TD.

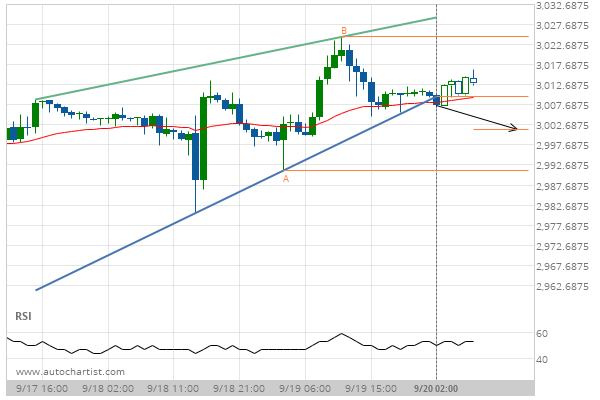
Rising Wedge has broken through the support line at 20-Sep-2019 02:00 EDT. Possible bearish price movement forecast for the next 13 hours towards 3001.4746.

Tags: CME, ES
0 Likes
770 Views

You may also like

E-mini S&P 500 down to 2803.7500
May 15, 2020
Lean Hogs up to 57.2500
September 14, 2018
E-mini S&P 500 up to 2724.7972
April 1, 2020

Comments are closed.

Travelers Cos Inc. is on its way down Feeder Cattle Front Month up to 139.1350

Futures Technical Analysis – TD

Light Sweet Crude Oil Front Month up to 67.9800

March 9, 2021 11:17 am | By Autochartist

Rising Wedge identified at 09-Mar-2021 05:00 EST. This pattern is... Read more →

Feeder Cattle Front Month down to 137.2250

March 9, 2021 11:17 am | By Autochartist

Channel Down identified at 08-Mar-2021 14:00 EST. This pattern is... Read more →

Soybean Oil up to 53.2300

March 9, 2021 11:17 am | By Autochartist

Channel Up identified at 09-Mar-2021 04:30 EST. This pattern is... Read more →

Silver Front Month up to 26.5600

March 9, 2021 11:17 am | By Autochartist

Approaching Resistance level of 26.5600 identified at 09-Mar-2021 04:00 EST Read more →

10 year T-Note up to 133.1644

March 9, 2021 11:17 am | By Autochartist

Falling Wedge has broken through the resistance line at 09-Mar-2021... Read more →

  • About Us
  • Privacy Policy
  • Disclaimer
  • Terms and Conditions
  • Get started for FREE
  • Contact Us
Copyright © 2022 Autochartist.com. All rights reserved.
This site uses cookies: Find out more.