Help & Documentation
  • Home
  • Sign In
  • Contact Us
  • Home
  • Sign In
  • Contact Us

DowDuPont (DWDP) down to 32.47

/US Stocks Technical Analysis - TD/DowDuPont (DWDP) down to 32.47

DowDuPont (DWDP) down to 32.47

Posted on May 6, 2019 by Autochartist wrote in US Stocks Technical Analysis - TD.

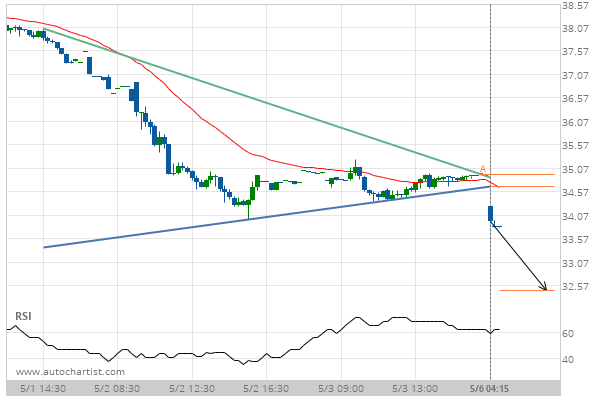
Triangle has broken through the support line at 06-May-2019 04:15 EDT. Possible bearish price movement forecast for the next 5 hours towards 32.47.

Tags: DowDuPont, DWDP, NYSE
0 Likes
881 Views

You may also like

3m Co. (MMM) up to 210.51
March 28, 2019
Intel Corporation (INTC) down to 57.55
January 16, 2020
Pfizer Inc. (PFE) down to 38.20
July 31, 2020

Comments are closed.

Chevron (CVX) excessive bearish movement Home Depot Inc. (HD) down to 198.66

US Stocks Technical Analysis – TD

Merck & Co. Inc. (MRK) up to 75.56

March 9, 2021 11:13 am | By Autochartist

Rising Wedge identified at 08-Mar-2021 19:30 EST. This pattern is... Read more →

Visa (V) down to 215.41

March 9, 2021 11:13 am | By Autochartist

Triangle identified at 08-Mar-2021 20:00 EST. This pattern is still... Read more →

Jpmorgan Chase & Co. (JPM) down to 147.97

March 9, 2021 11:13 am | By Autochartist

Channel Up identified at 08-Mar-2021 19:00 EST. This pattern is... Read more →

Home Depot Inc. (HD) down to 247.10

March 9, 2021 11:13 am | By Autochartist

Channel Down identified at 08-Mar-2021 16:00 EST. This pattern is... Read more →

Intel Corporation () down to 58.10

March 9, 2021 11:13 am | By Autochartist

Approaching Support level of 58.10 identified at 08-Mar-2021 16:00 EST Read more →

  • About Us
  • Privacy Policy
  • Disclaimer
  • Terms and Conditions
  • Get started for FREE
  • Contact Us
Copyright © 2022 Autochartist.com. All rights reserved.
This site uses cookies: Find out more.