Ежедневное обновление Forex: USD / JPY
От: Dima Chernovolov
USD/JPY recently broke the well-formed Triangle chart pattern which was previously identified by Autochartist on the 4-hour charts. Autochartist measures the quality of this Triangle at the 8-bar level – which is the result of the medium Initial Trend (6 брусья) и сильная Однородность и Ясность (оба оцененные на 8 уровень бар). Autochartist rates the strength of this breakout at the near-maximum, 9-bar level – which adds to the probability USD/JPY will soon reach the forecast price 110.46.

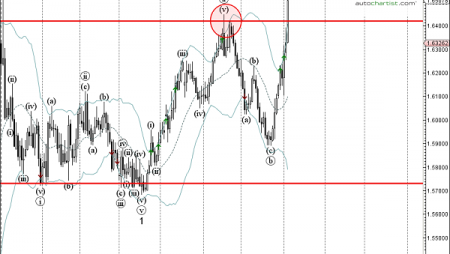
Как видно из диаграммы ежедневно USD / JPY ниже, the bottom of this Triangle formed when the pair reversed up with the daily Hammer from the support zone lying between the key support level 108.80 (which also reversed the price with the daily Morning Star earlier this month) а нижняя полоса Боллинджера ежедневно. The proximity of this support area and the bullish divergence on the daily Stochastic indicator increase the probability USD/JPY will continue to rise toward the forecast price 110.46.

Для того, чтобы подписаться на электронную почту функция сообщает быстро и легко. Вход в платформу Autochartist, нажмите на ссылку «Оповещения & сообщения», Введите ваш адрес электронной почты, выбрать на рынке вы хотите покрытый, Выберите ваш язык, и время, которое вы хотите получить отчет, и вы сделали! Теперь вы будете получать быстрый утренний технический прогноз рынков.
Для получения более подробной информации об этом и других продуктах Autochartist посетите www.autochartist.com


