Daily Forex Update: USD/CAD
By: Dima Chernovolov
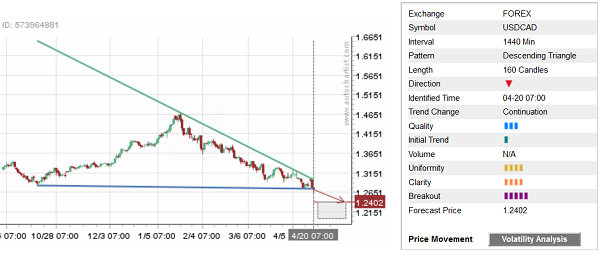
As you can see below – Autochartist recently identified the breakout of the extended daily Descending Triangle (its length is equal to 160 candles/trading days). The overall Quality of this chart pattern is measured by Autochartist at the 3-bar level – which is a result of the below-average Uniformity and Clarity (both rated at the 4 bars level) and lower Initial Trend (one bar). The strength of the Breakout is measured by Autochartist at the 5 bar level. USD/CAD is likely to fall to the Forecast Level 1.2402.

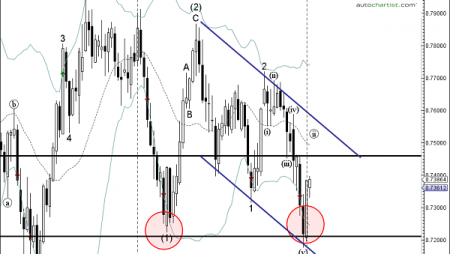
As you can see from the daily USD/CAD chart below – the breakout of this Descending Triangle coincided with the breakout of the major long-term support level 1.2800, which reversed the price in July and October of 2015. This chart pattern breakout also follows the earlier breakout of the round support level 1.3000 and the 61.8% Fibonacci correction of the earlier upward impulse from 2015 – which adds to the likelihood the pair will continue to fall toward the Forecast Level 1.2402 in the coming trading sessions.

For further information on this and other Autochartist products visit www.autochartist.com