Daily Forex Update: USD/CAD
By: Dima Chernovolov
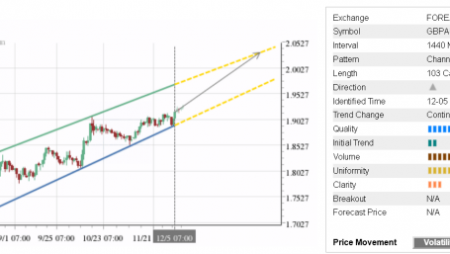
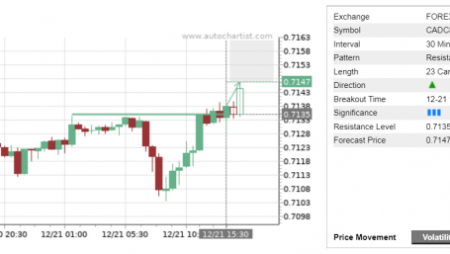
USD/CAD continues to fall after the earlier breakout of the Triangle chart pattern which was previously identified by Autochartist on the hourly charts. Autochartist rates the Quality of this Triangle at the 5 bar level – which is the result of the strong Initial Trend (9 bars) and lower Clarity (3 bars). The strength of the breakout is rated by Autochartist at the maximum, 10-bar level – which adds to the likelihood USD/CAD will continue to fall toward the Forecast Price 1.3029.

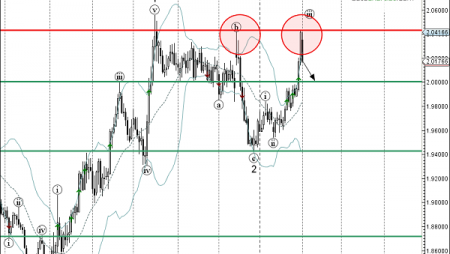
As you can see from the daily USD/CAD chart below, the top of this Triangle formed when the pair reversed down from the resistance zone lying between the long-term resistance level 1.3240 (previous monthly high from July), upper daily Bollinger Band and 38.2% Fibonacci correction of the downward impulse form January. The proximity of this resistance zone increases the probability USD/CAD will soon reach the Forecast Price 1.3029.

To subscribe to the e-mail alerts feature is quick and easy. Log into the Autochartist platform, click on ‘Alerts & Messaging’, enter your email address, select the market you want covered, select your language, and the time you want to get your report, and you’re done! You will now receive a quick morning technical outlook of the markets.
For further information on this and other Autochartist products visit www.autochartist.com