Daily Forex Update: USD/JPY
By: Dima Chernovolov
USD/JPY continues to fall inside the clear daily Triangle chart pattern which was recently identified by Autochartist. Autochartist measures the quality of this Triangle at the 6-bar level – which is the result of the slow Initial Trend (3 bars), significant Uniformity (7 bars) and higher Clarity (8 bars). USD/JPY is expected to fall further inside this Triangle – in line with the earlier downward reversal from the strong resistance area shown below.
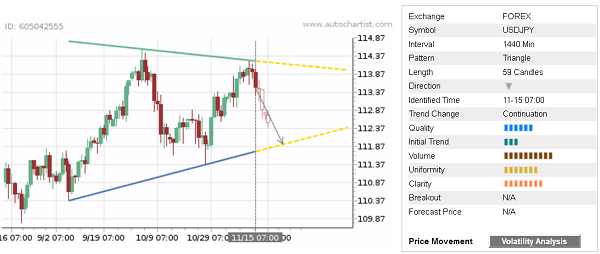
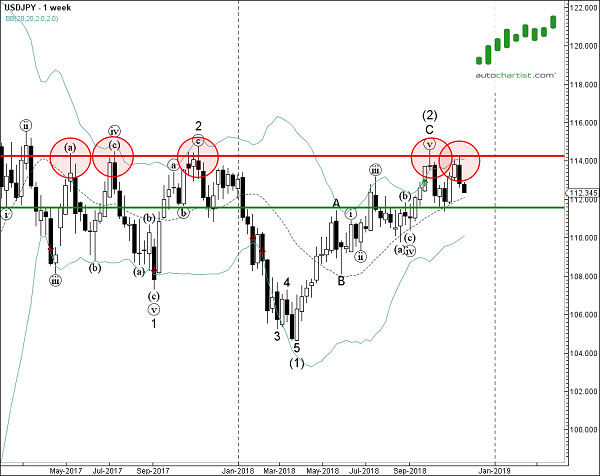
As can be seen from the weekly USD/JPY chart below, the top of this Triangle formed when the pair reversed down from the major resistance area lying between the long-term resistance level 114.30 (which has been repeatedly reversing the price from the middle of 2017) and the upper weekly Bollinger Band. The proximity of this resistance area increases the probability USD/JPY will continue to fall inside this Triangle.
To subscribe to the e-mail alerts feature is quick and easy. Log into the Autochartist platform, click on ‘Alerts & Messaging’, enter your email address, select the market you want covered, select your language, and the time you want to get your report, and you’re done! You will now receive a quick morning technical outlook of the markets.
For further information on this and other Autochartist products visit www.autochartist.com