Daily Forex Update: NZD/USD
By: Dima Chernovolov
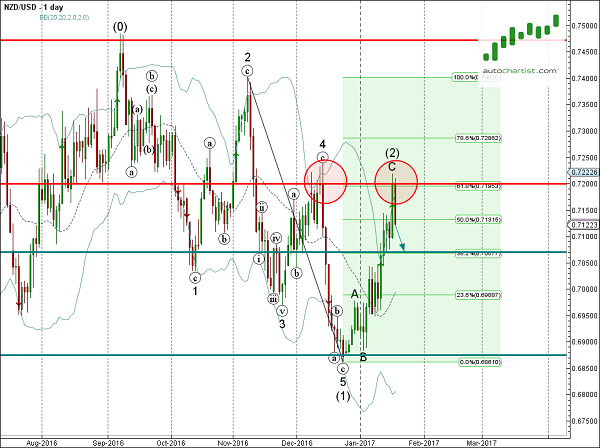
NZD/USD continues to fall after the recent breakout of the clear Up Channel chart pattern which was previously identified by Autochartist on the hourly charts. Autochartist measures the Quality of this Up Channel at the 7 bar level – which reflects the average Initial Trend (5 bars), higher Uniformity (6 bars) and near-maximum Clarity (9 bars). Autochartist similarly measures the strength of this breakout at the 9-bar level. NZD/USD is expected to fall to the Forecast Price 0.7070.

As you can see from the daily NZD/USD chart below – the top of this Up Channel formed when the pair reversed down from the resistance zone lying between the key resistance level 0.7200 (which reversed the price sharply in December), upper daily Bollinger Band and the 61.8% Fibonacci correction of the downward impulse from November. The proximity of this resistance zone heightens the likelihood the pair will continue to fall toward the Forecast Price 0.7070 tomorrow.

To subscribe to the e-mail alerts feature is quick and easy. Log into the Autochartist platform, click on ‘Alerts & Messaging’, enter your email address, select the market you want covered, select your language, and the time you want to get your report, and you’re done! You will now receive a quick morning technical outlook of the markets.
For further information on this and other Autochartist products visit www.autochartist.com