Daily Forex Update: NZD/USD
By: Dima Chernovolov
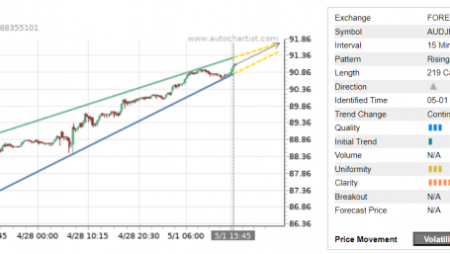
NZD/USD continues to rise after the recent breakout of the Triangle chart pattern which was previously identified by Autochartist on the 4-hour charts. Autochartist rates the Quality of this Triangle at the 4 bar level – which reflects the below-average Initial Trend (4 bars), higher Uniformity (6 bars), and medium Clarity (5 bars). NZD/USD is expected to rise toward the forecast price 0.7179 in the nearest time.

As can be seen from the daily NZD/USD chart below, the breakout of this Triangle follows the earlier sharp upward reversal from the support zone lying between the long-term support level 0.6970 (which has been reversing the pair from June), lower daily Bollinger Band and the 61.8% Fibonacci correction of the previous sharp upward price impulse from May.

To subscribe to the e-mail alerts feature is quick and easy. Log into the Autochartist platform, click on ‘Alerts & Messaging’, enter your email address, select the market you want covered, select your language, and the time you want to get your report, and you’re done! You will now receive a quick morning technical outlook of the markets.
For further information on this and other Autochartist products visit www.autochartist.com