Daily Forex Update: NZD/JPY
By: Dima Chernovolov
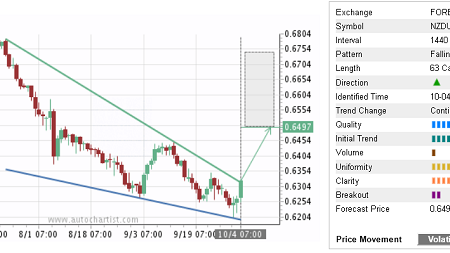
NZD/JPY recently broke the Clear Triangle chart pattern which was previously identified by Autochartist on the 4-hours charts. Autochartist measures the Quality of this Triangle at the 6 bar level – which is the result of the slow Initial Trend (2 bars), average Uniformity (5 bars) and substantial Clarity (8 bars). Autochartist rates the strength of this breakout at the maximum 10-bar level, which increases the probability NZD/JPY will soon reach the forecast price 80.60.

As can be seen from the following chart, the breakout of this Triangle continues the earlier sharp downward impulse from the powerful resistance zone lying between the long-term resistance level 83.400 (which reversed the price with the daily Evening Star in December) and the upper daily Bollinger Band. The proximity of this resistance zone should strengthen the bearish pressure on this currency pair and add to the likelihood NZD/JPY will soon reach the forecast price 80.60.

To subscribe to the e-mail alerts feature is quick and easy. Log into the Autochartist platform, click on ‘Alerts & Messaging’, enter your email address, select the market you want covered, select your language, and the time you want to get your report, and you’re done! You will now receive a quick morning technical outlook of the markets.
For further information on this and other Autochartist products visit www.autochartist.com