Daily Forex Update: NZD/JPY
By: Dima Chernovolov
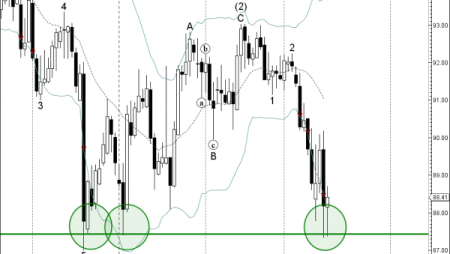
NZD/JPY continues to rise inside the hourly Up Channel chart pattern which was previously identified by Autochartist. Autochartist measures the quality of this Up Channel at the 4-bar level – which is the result of the below-average Initial Trend (4 bars), lower Uniformity (3 bars) and medium Clarity (5 bars). NZD/JPY is expected to rise further inside this Up Channel – in line with active daily impulse wave which recently broke through the resistance zone shown below.

As can be seen from the daily NZD/JPY chart below, the price earlier broke through the resistance zone lying between the key resistance level 80.500 (which also reversed the price in August and earlier this month), 38.2% Fibonacci correction of the previous minor ABC correction 2 and the 50-day moving average. This price area is acting as support zone after it was broken. The proximity of this support zone adds to the likelihood NZD/JPY will continue to rise inside this Up Channel.

To subscribe to the e-mail alerts feature is quick and easy. Log into the Autochartist platform, click on ‘Alerts & Messaging’, enter your email address, select the market you want covered, select your language, and the time you want to get your report, and you’re done! You will now receive a quick morning technical outlook of the markets.
For further information on this and other Autochartist products visit www.autochartist.com