Daily Forex Update: NZD/CAD
By: Dima Chernovolov
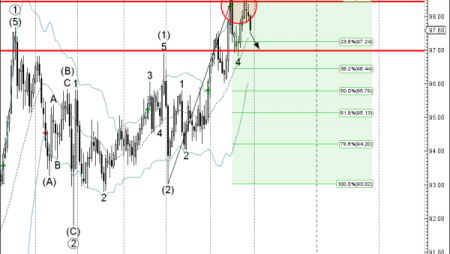
NZD/CAD continues to fall after the earlier breakout of the well-formed Descending Triangle chart pattern which was previously identified by Autochartist on the daily charts. Autochartist rates the Quality of this Descending Triangle at the 7 bar level – which is the result of the medium Initial Trend (5 bars) and near-maximum Uniformity and Clarity (both rated at the 9 bar level). NZD/CAD is expected to fall to the forecast price 0.9196 in the nearest time.

As can be seen from the daily NZD/CAD chart below, the breakout of this Descending Triangle coincided with the breakout of the support trendline of the extended weekly Triangle from July of 2016. The simultaneous breakout of the two different-scale chart patterns increases the probability the pair will continue to fall toward the forecast price 0.9196 in the coming trading sessions.

To subscribe to the e-mail alerts feature is quick and easy. Log into the Autochartist platform, click on ‘Alerts & Messaging’, enter your email address, select the market you want covered, select your language, and the time you want to get your report, and you’re done! You will now receive a quick morning technical outlook of the markets.
For further information on this and other Autochartist products visit www.autochartist.com