Daily Forex Update: NZD/CAD
By: Dima Chernovolov
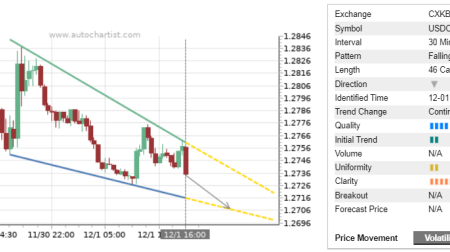
NZD/CAD continues to rise after the recent breakout of resistance trendline of the Clear Falling Wedge chart pattern which was earlier identified by Autochartist on the daily charts. Autochartist rates the Quality of this Falling Wedge at the 8 bar level – which reflects the sharp Initial Trend (rated at the maximum, 10 bar level), significant Uniformity (7 bars) and higher Clarity (8 bars). NZD/CAD is expected to rise toward the Forecast Price 0.9583 in the coming trading sessions.

As can be seen from the daily NZD/CAD chart below, the bottom of this Falling Wedge formed near the powerful support zone lying between the lower daily Bollinger Band and the multi-month support level 0.9280 (which also reversed the price sharply in August and October). The proximity of this support area increases the probability NZD/CAD will continue to rise toward the Forecast Price 0.9583 tomorrow.

To subscribe to the e-mail alerts feature is quick and easy. Log into the Autochartist platform, click on ‘Alerts & Messaging’, enter your email address, select the market you want covered, select your language, and the time you want to get your report, and you’re done! You will now receive a quick morning technical outlook of the markets.
For further information on this and other Autochartist products visit www.autochartist.com