Daily Forex Update: NZD/CAD
By: Dima Chernovolov
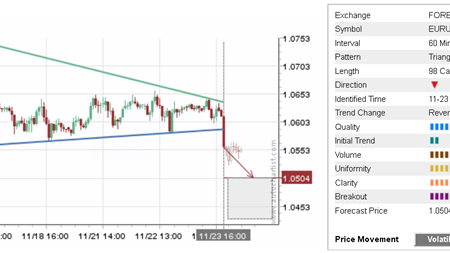
NZD/CAD continues to fall inside the uniform Falling Wedge chart pattern which was previously identified by Autochartist on the 15-minute charts. Autochartist rates the quality of this Falling Wedge at the 6-bar level – which reflects the slow Initial Trend (1 bar), near-maximum Uniformity (9 bars) and significant Clarity (8 bars). NZD/CAD is expected to fall further inside this chart pattern – in line with the active daily impulse wave from the resistance zone shown below.

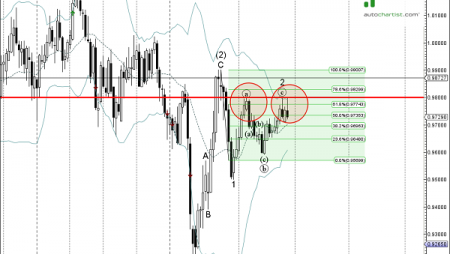
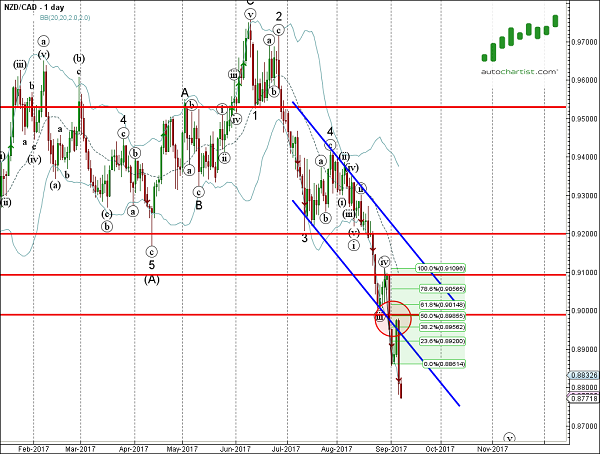
As can be seen from the daily NZD/CAD chart below, this Falling Wedge continues the active daily impulse wave from the resistance zone located between the round resistance level 0.9000 (former support from the end of August), lower trendline of the daily Down Channel from July (acting as resistance after it was broken) and the 38.2% Fibonacci correction of the downward impulse from the end of August. The proximity of this resistance area increases the probability NZD/CAD will continue to decline inside Falling Wedge.

To subscribe to the e-mail alerts feature is quick and easy. Log into the Autochartist platform, click on ‘Alerts & Messaging’, enter your email address, select the market you want covered, select your language, and the time you want to get your report, and you’re done! You will now receive a quick morning technical outlook of the markets.
For further information on this and other Autochartist products visit www.autochartist.com