Daily Forex Update: NZD/USD
By: Dima Chernovolov
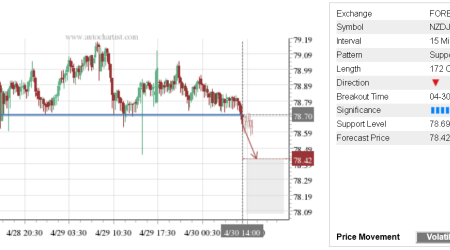
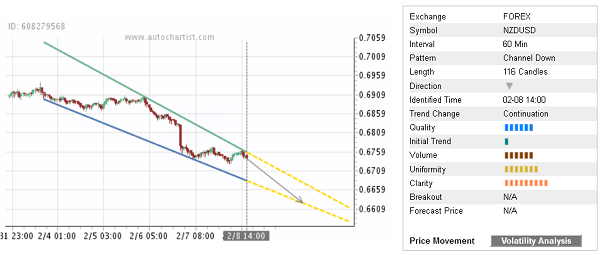
NZD/USD continues to fall inside the hourly Down Channel chart pattern which was previously identified by Autochartist. Autochartist rates the quality of this Down Channel at the 6-bar level – which is the result of the slow Initial Trend (1 bar), significant Uniformity (7 bars) and strong Clarity (9 bars). NZD/USD is expected fall rise further inside this Up Channel – in line with the earlier downward reversal from the resistance area shown below.
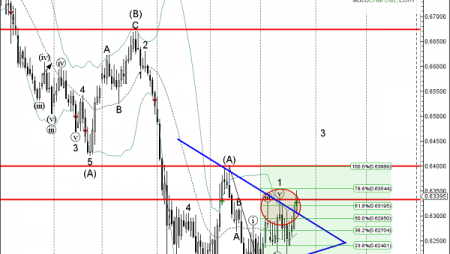
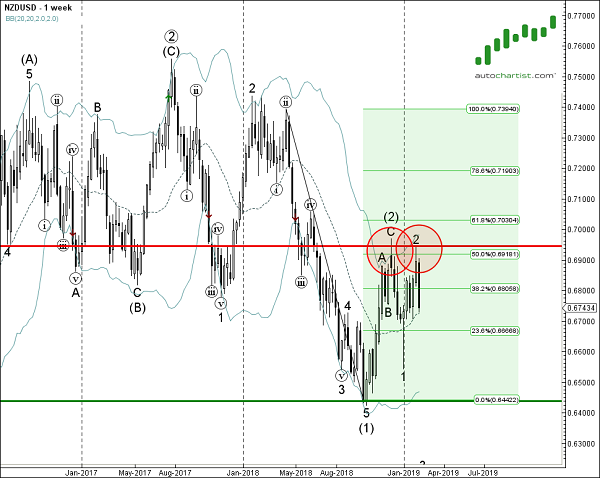
As can be seen from the weekly NZD/USD below, the pair recently reversed down from the strong resistance area lying between the key resistance level 0.6950 (which also reversed the price in December), upper weekly Bollinger Band and the 50% Fibonacci correction of the previous downward impulse from last year. The proximity of this resistance area increases the probability NZD/USD will continue to fall inside this Down Channel.
As can be seen from the weekly NZD/USD below, the pair recently reversed down from the strong resistance area lying between the key resistance level 0.6950 (which also reversed the price in December), upper weekly Bollinger Band and the 50% Fibonacci correction of the previous downward impulse from last year. The proximity of this resistance area increases the probability NZD/USD will continue to fall inside this Down Channel.