Daily Forex Update: GBP/JPY
By: Dima Chernovolov
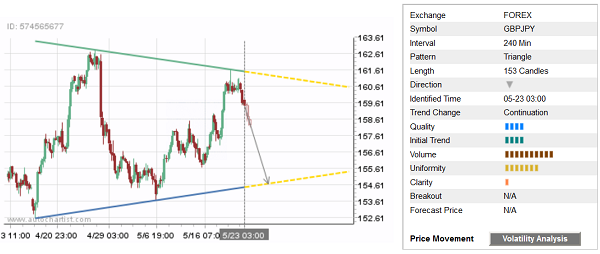
As you can see from the following chart – Autochartist recently identified the extended Triangle on the 4-hour GBP/JPY charts. Autochartist measures the Quality of this chart pattern at the 4 bar level – which is the result of the lower Initial Trend and Clarity (rated at the 4 and 1 bar levels respectively) and above-average Uniformity (7 bars). Higher Uniformity reflect the even distribution of the price pivots on which this Triangle is based. GBP/JPY is likely to fall to the lower trendline of this chart pattern.

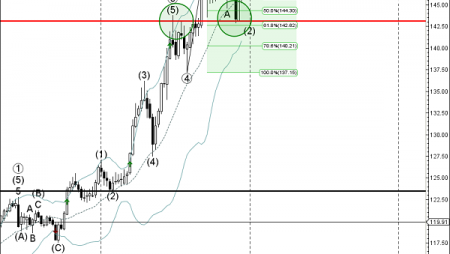
As you can see from the daily GBP/JPY chart below – the price earlier reversed down from the strong resistance zone lying between the resistance level 162.40, upper daily Bollinger Band, 200-day moving average and 38.2% Fibonacci correction of the previous downward impulse from February. The proximity of this resistance zone increases the probability the pair will continue to fall inside this Triangle.

To subscribe to the e-mail alerts feature is quick and easy. Log into the Autochartist platform, click on ‘Alerts & Messaging’, enter your email address, select the market you want covered, select your language, and the time you want to get your report, and you’re done! You will now receive a quick morning technical outlook of the markets.
For further information on this and other Autochartist products visit www.autochartist.com