Daily Forex Update: GBP/AUD
By: Dima Chernovolov
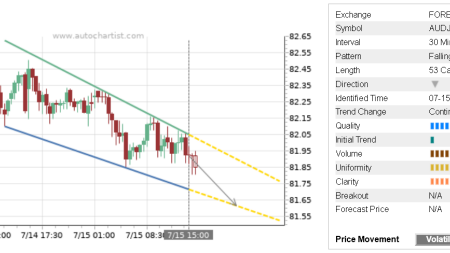
Autochartist recently identified the Falling Wedge chart pattern on the hourly GBP/AUD charts. Autochartist rates the Quality of this Falling Wedge at the 5 bar level – which is the result of the slow Initial Trend (1 bar), average Uniformity (5 bars) and near-maximum Clarity (9 bars). GBP/AUD is expected to continue to fall inside Falling Wedge – in line the recent downward price impulse from the resistance area described below.

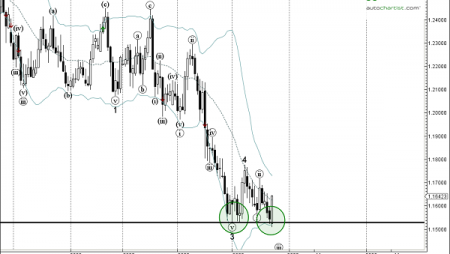
As can be seen from the weekly GBP/AUD chart below, this chart pattern continues the active downward price impulse which started earlier from the resistance zone located between the strong resistance level 1.7630 (which has been reversing the pair from July of 2016), upper weekly Bollinger Band and the 38.2% Fibonacci correction of the downward impulse from May of 2016. The proximity of this resistance zone adds to the probability GBP/AUD will continue to fall inside this Falling Wedge.

To subscribe to the e-mail alerts feature is quick and easy. Log into the Autochartist platform, click on ‘Alerts & Messaging’, enter your email address, select the market you want covered, select your language, and the time you want to get your report, and you’re done! You will now receive a quick morning technical outlook of the markets.
For further information on this and other Autochartist products visit www.autochartist.com