Daily Forex Update: GBP/NZD
By: Dima Chernovolov
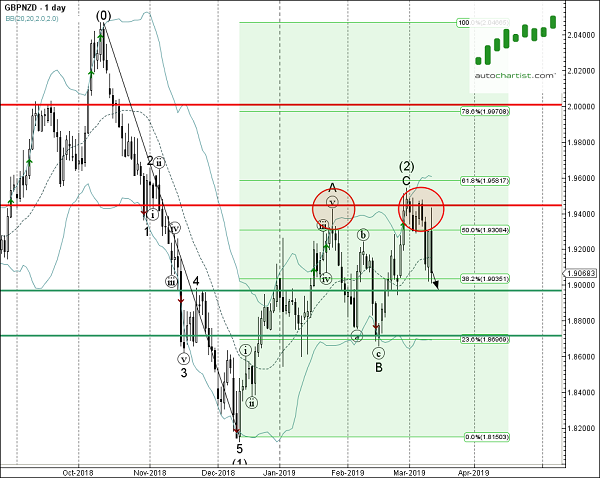
GBP/NZD continues to fall inside the clear daily Rising Wedge chart pattern which was previously identified by Autochartist. Autochartist rates the quality of this Rising Wedge chart at the 7-bar level – which is the result of the sharp Initial Trend (10 bars), above-average Uniformity and Clarity (6 bars) GBP/NZD is expected to fall further inside this chart pattern – in line with the earlier downward reversal from the key resistance area shown below.
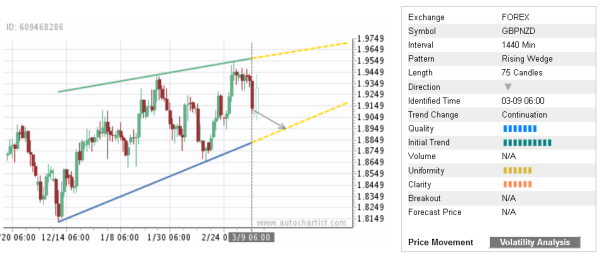
As can be seen from the daily GBP/NZD below, the price earlier reversed down from the resistance area lying between the key support resistance 1.9450 (monthly high from January), upper daily Bollinger Band and the 61.8% Fibonacci correction of the previous sharp downward impulse from October. The proximity of this resistance area increases the probability GBP/NZD will continue fall inside this Rising Wedge.