Daily Forex Update: EUR/CAD
By: Dima Chernovolov
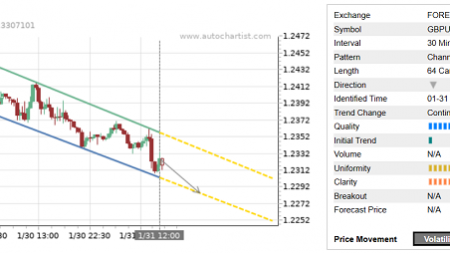
EUR/CAD continues to fall inside the uniform Descending Triangle chart pattern which was previously identified by Autochartist on the 4-hours charts. Autochartist measures the Quality of this Descending Triangle at the 4 bar level – which reflects the below-average Initial Trend (4 bars), higher Uniformity (7 bars) and lower Clarity (1 bar). EUR/CAD is expected to fall toward the support trendline of this Descending Triangle.

As is visisble from the daily EUR/CAD chart below – both of the connecting points of the upper resistance trendline of this Descending Triangle formed when the price reversed down from the resistance zone lying between the resistance 1.4320, upper daily Bollinger Band and the 38.2% Fibonacci retracement of the previous downward impulse from November. The latest downward reversal from this resistance zone created the daily Japanese candlesticks reversal pattern Evening Star – which adds to the probability the price will continue to fall inside this Descending Triangle.

To subscribe to the e-mail alerts feature is quick and easy. Log into the Autochartist platform, click on ‘Alerts & Messaging’, enter your email address, select the market you want covered, select your language, and the time you want to get your report, and you’re done! You will now receive a quick morning technical outlook of the markets.
For further information on this and other Autochartist products visit www.autochartist.com