Daily Forex Update: EUR/CAD
By: Dima Chernovolov
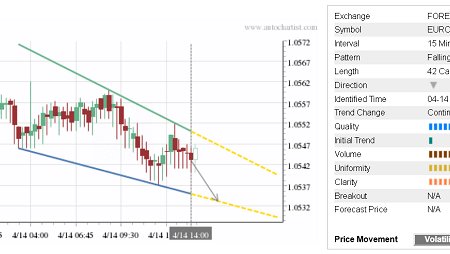
EUR/CAD continues to fall inside the hourly Falling Wedge chart pattern which was previously identified by Autochartist. Autochartist rates the quality of this Falling Wedge at the 5-bar level – which is the result of the slow Initial Trend (one bar), strong Uniformity (7 bars) and near-maximum Clarity (9 bars). EUR/CAD is expected to fall further inside this Falling Wedge – in line with the earlier downward reversal from the multi-year resistance level shown below.

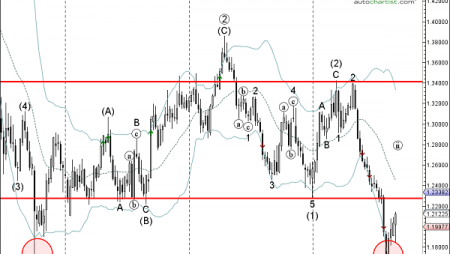
As can be seen from the weekly EUR/CAD chart below, the price earlier reversed down from the resistance zone lying between the multi-year resistance 1.6110 (which stopped the sharp uptrend in January of 2016), upper weekly Bollinger Band and the resistance trendline of the weekly up channel from the start of 2017. The proximity of this resistance zone and the overbought weekly Stochastic increase the probability EUR/CAD will continue to fall inside this chart pattern.

To subscribe to the e-mail alerts feature is quick and easy. Log into the Autochartist platform, click on ‘Alerts & Messaging’, enter your email address, select the market you want covered, select your language, and the time you want to get your report, and you’re done! You will now receive a quick morning technical outlook of the markets.
For further information on this and other Autochartist products visit www.autochartist.com