Daily Forex Update: CAD/JPY
By: Dima Chernovolov
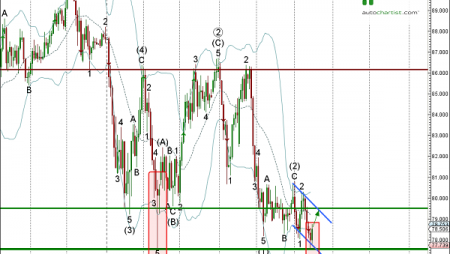
CAD/JPY continues to rise after the earlier breakout of the Key Resistance level 82.88, which was previously identified by Autochartist on the 4-hours charts. Autochartist measures the Significance of this resistance level at the 3 bar level – which corresponds to the three earlier price reversals from this resistance level. CAD/JPY is expected to rise toward the forecast price 83.6578 – continuing the active upward impulse wave from the support zone described below.

As you can see from the daily CAD/JPY chart below, the price earlier reversed up from the strong support zone lying between the key support level 82.00 (previous strong resistance level from July of 2016), lower daily Bollinger Band and the 50% Fibonacci correction of the sharp upward impulse from November. The proximity of this support zone adds to the likelihood CAD/JPY will continue to rise toward the forecast price 83.6578.

To subscribe to the e-mail alerts feature is quick and easy. Log into the Autochartist platform, click on ‘Alerts & Messaging’, enter your email address, select the market you want covered, select your language, and the time you want to get your report, and you’re done! You will now receive a quick morning technical outlook of the markets.
For further information on this and other Autochartist products visit www.autochartist.com