Daily Forex Update: CAD/JPY
By: Dima Chernovolov
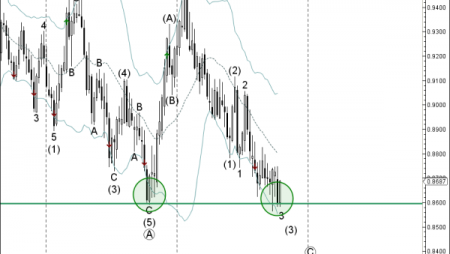
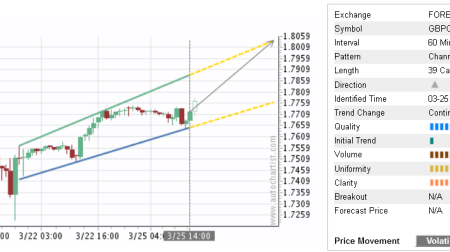
CAD/JPY continues to fall after the earlier breakout of the daily Rising Wedge chart pattern which was previously identified by Autochartist. Autochartist rates the quality of this Rising Wedge at the 7 bar level – which reflects the average Initial Trend (5 bars), lower Uniformity (4 bars) and maximum Clarity (10 bar). CAD/JPY is expected to continue to fall toward the forecast price 86.38 – in line with the earlier downward reversal from the resistance zone shown below.

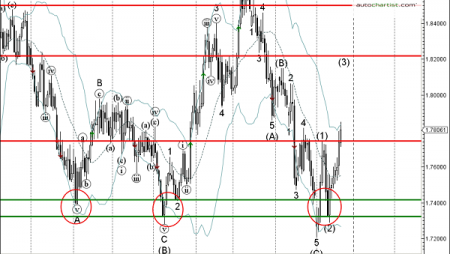
As can be seen from the weekly CAD/JPY chart below, the the top of this Rising Wedge formed when the price reversed down from the powerful resistance zone lying between the major resistance level 88.70 (which reversed the price twice in 2016), upper weekly Bollinger Band and the 50% Fibonacci retracement of the downward impulse from 2015. The proximity of this resistance zone increases the probability CAD/JPY will soon reach the forecast price 86.38.

To subscribe to the e-mail alerts feature is quick and easy. Log into the Autochartist platform, click on ‘Alerts & Messaging’, enter your email address, select the market you want covered, select your language, and the time you want to get your report, and you’re done! You will now receive a quick morning technical outlook of the markets.
For further information on this and other Autochartist products visit www.autochartist.com