Daily Forex Update: CAD/JPY
By: Dima Chernovolov
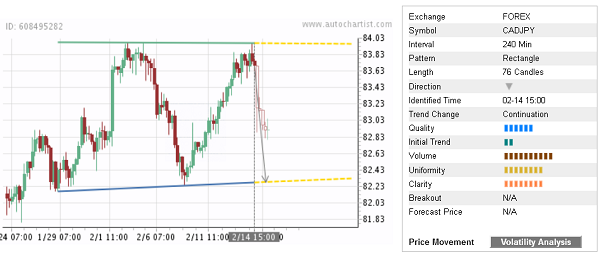
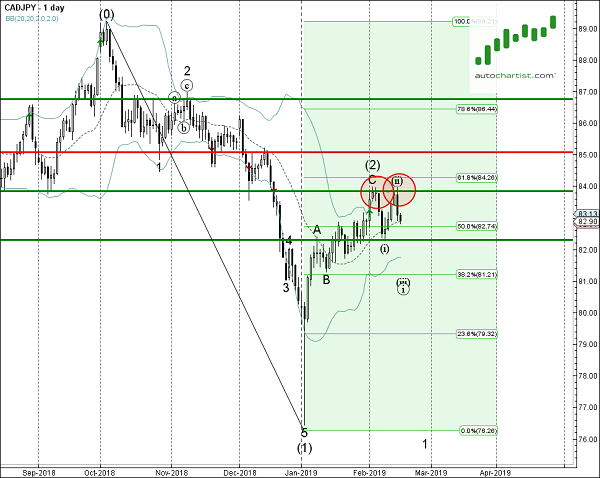
CAD/JPY continues to fall inside the 4-hour Rectangle chart pattern which was previously identified by Autochartist. Autochartist rates the quality of this Rectangle at the 6-bar level – which is the result of the slow Initial Trend (2 bars), and strong Uniformity and Clarity (both rated at the 8 bars level). CAD/JPY is expected to rise further inside this Rectangle – in line with the earlier downward reversal from the key resistance area shown below.
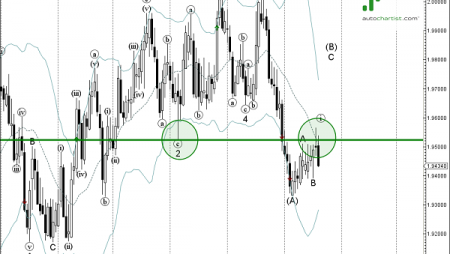
As can be seen from the daily CAD/JPY below, the price earlier down up from the resistance area lying at the intersection of the key resistance level 84.00 (also reversed the price earlier this month), lower daily Bollinger Band and 61.8% Fibonacci correction of the previous sharp downward impulse from October. The proximity of this resistance area increases the probability CAD/JPY will continue to fall inside this Rectangle.
To subscribe to the e-mail alerts feature is quick and easy. Log into the Autochartist platform, click on ‘Alerts & Messaging’, enter your email address, select the market you want covered, select your language, and the time you want to get your report, and you’re done! You will now receive a quick morning technical outlook of the markets.
For further information on this and other Autochartist products visit www.autochartist.com