Daily Forex Update: AUD/USD
By: Dima Chernovolov
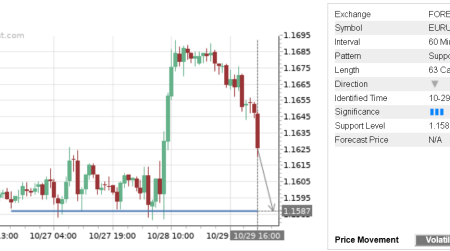
Autochartist earlier identified the breakout of the high-quality Up Channel chart pattern on the hourly AUD/USD charts. The overall Quality of this chart pattern is measured at the 8-bar level – which reflects the average Initial trend (5 bars) and substantial Uniformity and Clarity (rated at the 8-bar and 9–bar levels respectively). Autochartist measures the strength of this Up Channel breakout at the maximum – 10-bar level. AUD/USD is likely to fall to the Forecast Price 0.7306.

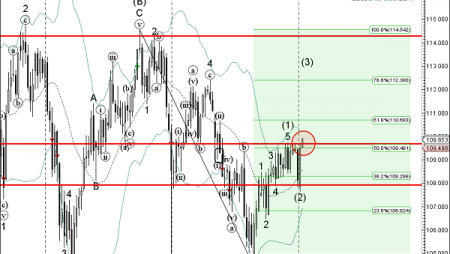
As can be seen from the following daily AUD/USD chart – the breakout of this Up Channel follows the earlier breakout of the strong support zone lying between the pivotal support level 0.7500 (which has been reversing the price from March, as can be seen below) and the 38.2% Fibonacci correction of the previous sharp intermediate impulse wave from February. Given the strength of the recent downward pressure on this pair – AUD/USD is likely to fall to the forecast price 0.7306 in the nearest time.

To subscribe to the e-mail alerts feature is quick and easy. Log into the Autochartist platform, click on ‘Alerts & Messaging’, enter your email address, select the market you want covered, select your language, and the time you want to get your report, and you’re done! You will now receive a quick morning technical outlook of the markets.
For further information on this and other Autochartist products visit www.autochartist.com