Daily Forex Update: AUD/USD
By: Dima Chernovolov
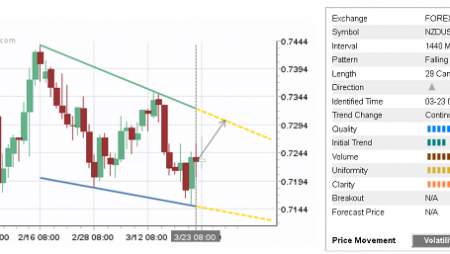
AUD/USD continues to rise after the earlier breakout of the Clear Down Channel chart pattern which was recently identified by Autochartist on the 4-hour charts. Autochartist measures the Quality of this Down Channel at the 7 bar level – which is the result of the sharp Initial Trend (rated at the maximum 10-bar level), average Uniformity (5 bars) and significant Clarity (8 bars). AUD/USD is expected to rise to the forecast price 0.7633 – in line with the technical analysis shown below.

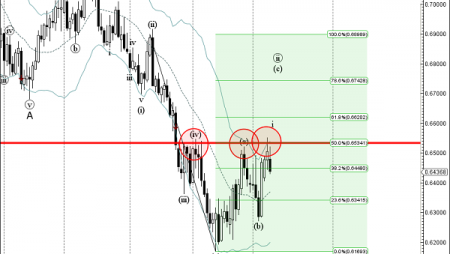
As you can see from the daily AUD/USD chart below, the breakout of this Down Channel follows the earlier sharp upward reversal from the support zone lying between the pivotal support level 0.7500 (monthly low from March), lower daily Bollinger Band and the 38.2% Fibonacci correction of the previous sharp upward impulse from December. The proximity of this support zone adds to the likelihood AUD/USD will continue to rise toward the forecast price 0.7633.

To subscribe to the e-mail alerts feature is quick and easy. Log into the Autochartist platform, click on ‘Alerts & Messaging’, enter your email address, select the market you want covered, select your language, and the time you want to get your report, and you’re done! You will now receive a quick morning technical outlook of the markets.
For further information on this and other Autochartist products visit www.autochartist.com