Daily Forex Update: AUD/USD
By: Dima Chernovolov
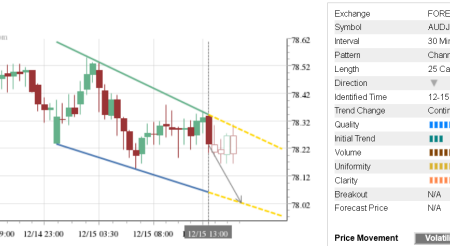
AUD/USD recently broke the Down Channel chart pattern which was previously identified by Autochartist on the 4-hour charts. Autochartist rates the quality of this Down Channel at the 7 bar level – which reflects the slow Initial Trend (4 bars), below-average Uniformity (4 bars) and significant Clarity (8 bars). Autochartist measures the strength of this breakout at the maximum, 10-bar level – which heightens the likelihood AUD/USD will soon reach the forecast price 0.7969.

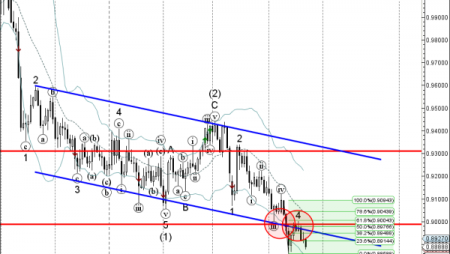
As can be seen from the weekly AUD/USD chart below, the bottom of this Down Channel formed when the pair reversed up from the support area lying between the major support level 0.7800 (former multi-month resistance level from April of 2016) and the 38.2% Fibonacci correction of the weekly upward impulse from May. The proximity of this support zone adds to the probability AUD/USD will continue to rise to the forecast price 0.7969.

To subscribe to the e-mail alerts feature is quick and easy. Log into the Autochartist platform, click on ‘Alerts & Messaging’, enter your email address, select the market you want covered, select your language, and the time you want to get your report, and you’re done! You will now receive a quick morning technical outlook of the markets.
For further information on this and other Autochartist products visit www.autochartist.com