Help & Documentation
  • Home
  • Sign In
  • Contact Us
  • Home
  • Sign In
  • Contact Us

Corn up to 558.0000

/Futures Technical Analysis - TD/Corn up to 558.0000

Corn up to 558.0000

Posted on February 8, 2021 by admin wrote in Futures Technical Analysis - TD.

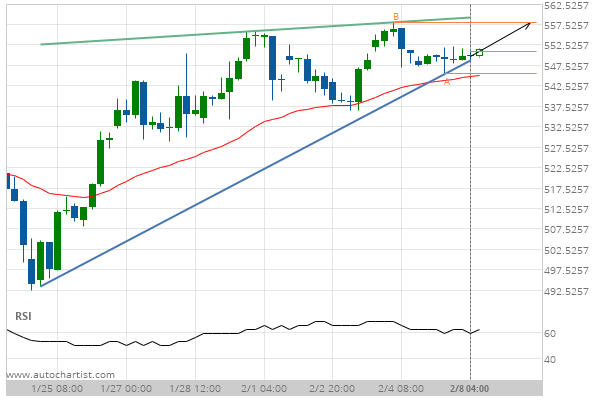
Rising Wedge identified at 08-Feb-2021 04:00 EST. This pattern is still in the process of forming. Possible bullish price movement towards the resistance 558.0000 within the next 3 days.

Tags: CBOT, ZC
0 Likes
26 Views

You may also like

US T-Bond down to 164.4375
September 2, 2019
Soybean Oil up to 30.6400
March 4, 2019
Corn down to 375.7500
January 30, 2019

Comments are closed.

US T-Bond up to 167.6250 Lean Hogs up to 79.9500

Futures Technical Analysis – TD

KC HRW Wheat down to 643.2500

February 26, 2021 11:15 am | By admin

Channel Down identified at 26-Feb-2021 04:00 EST. This pattern is... Read more →

Soybean Oil down to 49.0700

February 26, 2021 11:15 am | By admin

Falling Wedge identified at 26-Feb-2021 05:30 EST. This pattern is... Read more →

Soybeans down to 1365.0000

February 26, 2021 11:15 am | By admin

Approaching Support level of 1365.0000 identified at 25-Feb-2021 21:00 EST Read more →

Silver Front Month down to 26.5090

February 26, 2021 11:15 am | By admin

Broke through Support level of 27.2200 at 26-Feb-2021 01:00 EST Read more →

Light Sweet Crude Oil Front Month up to 63.6700

February 26, 2021 11:15 am | By admin

Rising Wedge identified at 26-Feb-2021 06:00 EST. This pattern is... Read more →

  • About Us
  • Privacy Policy
  • Disclaimer
  • Terms and Conditions
  • Get started for FREE
  • Contact Us
Copyright © 2020 Autochartist.com. All rights reserved.
This site uses cookies: Find out more.