Help & Documentation
  • Home
  • Sign In
  • Contact Us
  • Home
  • Sign In
  • Contact Us

Corn up to 455.1108

/Futures Technical Analysis - TD/Corn up to 455.1108

Corn up to 455.1108

Posted on December 25, 2020 by Autochartist wrote in Futures Technical Analysis - TD.

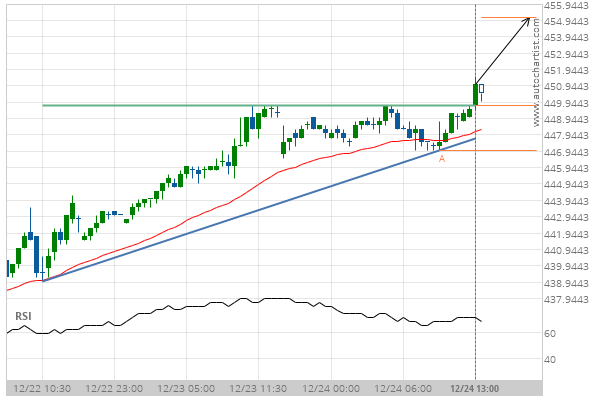
Ascending Triangle has broken through the resistance line at 24-Dec-2020 13:00 EST. Possible bullish price movement forecast for the next 11 hours towards 455.1108.

Tags: CBOT, ZC
0 Likes
376 Views

You may also like

10 year T-Note down to 122.4969
March 14, 2019
E-mini S&P 500 down to 3279.0000
January 20, 2020
Soybean Meal down to 375.8000
December 15, 2020

Comments are closed.

Gold Front Month up to 1912.0000 GBP/USD excessive bearish movement

Futures Technical Analysis – TD

Light Sweet Crude Oil Front Month up to 67.9800

March 9, 2021 11:17 am | By Autochartist

Rising Wedge identified at 09-Mar-2021 05:00 EST. This pattern is... Read more →

Feeder Cattle Front Month down to 137.2250

March 9, 2021 11:17 am | By Autochartist

Channel Down identified at 08-Mar-2021 14:00 EST. This pattern is... Read more →

Soybean Oil up to 53.2300

March 9, 2021 11:17 am | By Autochartist

Channel Up identified at 09-Mar-2021 04:30 EST. This pattern is... Read more →

Silver Front Month up to 26.5600

March 9, 2021 11:17 am | By Autochartist

Approaching Resistance level of 26.5600 identified at 09-Mar-2021 04:00 EST Read more →

10 year T-Note up to 133.1644

March 9, 2021 11:17 am | By Autochartist

Falling Wedge has broken through the resistance line at 09-Mar-2021... Read more →

  • About Us
  • Privacy Policy
  • Disclaimer
  • Terms and Conditions
  • Get started for FREE
  • Contact Us
Copyright © 2022 Autochartist.com. All rights reserved.
This site uses cookies: Find out more.