Help & Documentation
  • Home
  • Sign In
  • Contact Us
  • Home
  • Sign In
  • Contact Us

Corn up to 380.4394

/Futures Technical Analysis - TD/Corn up to 380.4394

Corn up to 380.4394

Posted on March 22, 2019 by admin wrote in Futures Technical Analysis - TD.

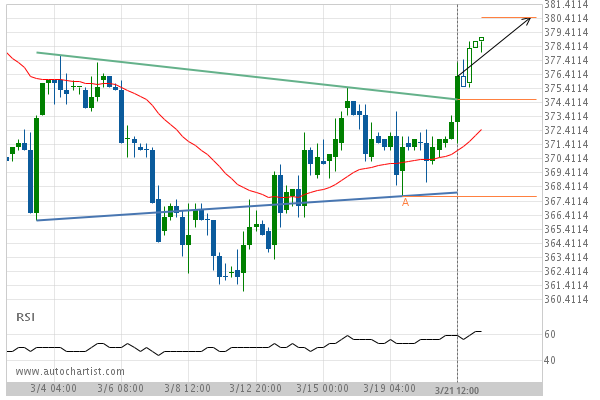
Inverse Head and Shoulders has broken through the resistance line at 21-Mar-2019 12:00 EDT. Possible bullish price movement forecast for the next 3 days towards 380.4394.

Tags: CBOT, ZC
0 Likes
427 Views

You may also like

Lean Hogs up to 72.1250
October 28, 2019
Soybean Meal down to 301.8000
October 16, 2019
10 year T-Note up to 139.6563
May 18, 2020

Comments are closed.

Silver Front Month down to 15.1350 Soybeans up to 912.0000

Futures Technical Analysis – TD

Gold Front Month up to 1894.1381

January 15, 2021 11:18 am | By admin

Triangle has broken through the resistance line at 14-Jan-2021 12:00... Read more →

Feeder Cattle Front Month down to 132.6750

January 15, 2021 11:18 am | By admin

Flag identified at 14-Jan-2021 15:00 EST. This pattern is still... Read more →

Soybean Oil up to 44.1800

January 15, 2021 11:18 am | By admin

Approaching Resistance level of 44.1800 identified at 14-Jan-2021 13:00 EST Read more →

Soybeans up to 1436.5000

January 15, 2021 11:18 am | By admin

Rising Wedge identified at 15-Jan-2021 05:00 EST. This pattern is... Read more →

Light Sweet Crude Oil Front Month down to 52.1300

January 15, 2021 11:18 am | By admin

Approaching Support level of 52.1300 identified at 15-Jan-2021 04:00 EST Read more →

  • About Us
  • Privacy Policy
  • Disclaimer
  • Terms and Conditions
  • Get started for FREE
  • Contact Us
Copyright © 2020 Autochartist.com. All rights reserved.
This site uses cookies: Find out more.