Help & Documentation
  • Home
  • Sign In
  • Contact Us
  • Home
  • Sign In
  • Contact Us

Corn up to 323.2000

/Futures Technical Analysis - TD/Corn up to 323.2000

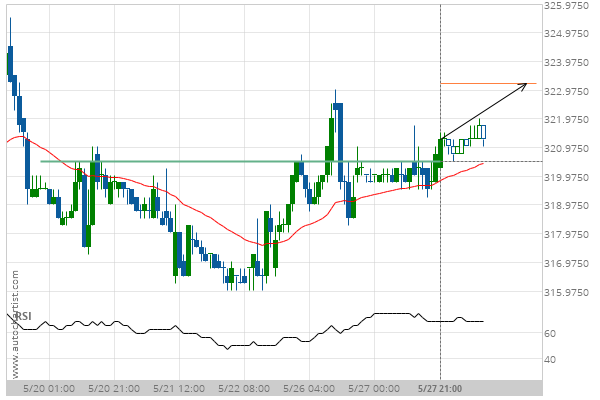
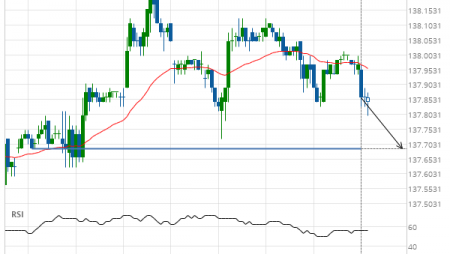
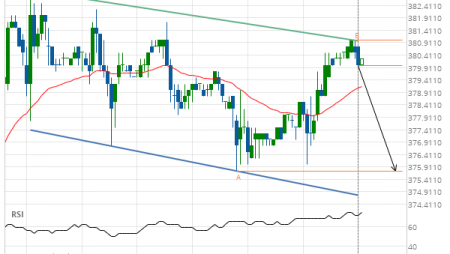
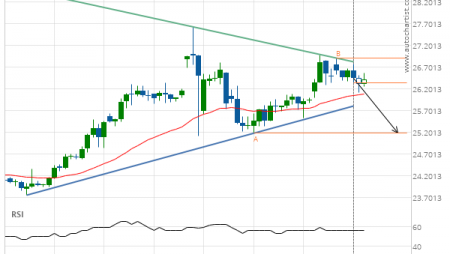
Corn up to 323.2000

Posted on May 28, 2020 by Autochartist wrote in Futures Technical Analysis - TD.

Broke through Resistance level of 320.5000 at 27-May-2020 21:00 EDT

Tags: ZC
0 Likes
400 Views

You may also like

Lean Hogs down to 80.5250
June 19, 2019
KC HRW Wheat down to 430.0000
November 26, 2019
Gold Front Month up to 2089.2000
August 7, 2020

Comments are closed.

CORN JULY 2020 excessive bullish movement Soybean Oil down to 26.9200

Futures Technical Analysis – TD

Light Sweet Crude Oil Front Month up to 67.9800

March 9, 2021 11:17 am | By Autochartist

Rising Wedge identified at 09-Mar-2021 05:00 EST. This pattern is... Read more →

Feeder Cattle Front Month down to 137.2250

March 9, 2021 11:17 am | By Autochartist

Channel Down identified at 08-Mar-2021 14:00 EST. This pattern is... Read more →

Soybean Oil up to 53.2300

March 9, 2021 11:17 am | By Autochartist

Channel Up identified at 09-Mar-2021 04:30 EST. This pattern is... Read more →

Silver Front Month up to 26.5600

March 9, 2021 11:17 am | By Autochartist

Approaching Resistance level of 26.5600 identified at 09-Mar-2021 04:00 EST Read more →

10 year T-Note up to 133.1644

March 9, 2021 11:17 am | By Autochartist

Falling Wedge has broken through the resistance line at 09-Mar-2021... Read more →

  • About Us
  • Privacy Policy
  • Disclaimer
  • Terms and Conditions
  • Get started for FREE
  • Contact Us
Copyright © 2020 Autochartist.com. All rights reserved.
This site uses cookies: Find out more.