Help & Documentation
  • Home
  • Sign In
  • Contact Us
  • Home
  • Sign In
  • Contact Us

CORN JULY 2019 excessive bearish movement

/Futures Statistical Analysis - TD/CORN JULY 2019 excessive bearish movement

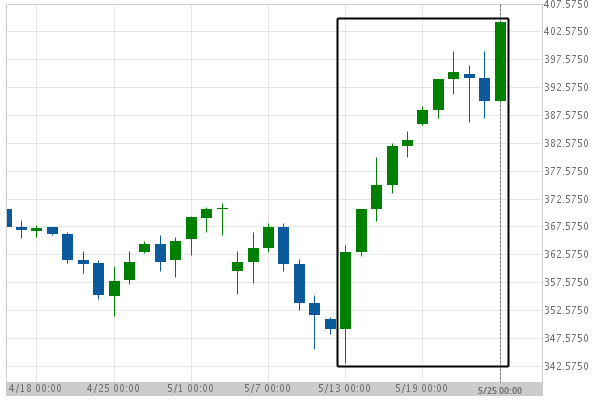
CORN JULY 2019 excessive bearish movement

Posted on May 27, 2019 by Autochartist wrote in Futures Statistical Analysis - TD.

CORN JULY 2019 experienced a 15.75% bullish movement in the last 12 days.

Tags: Big Movement, ZC
0 Likes
845 Views

You may also like

KC HRW Wheat excessive bearish movement
September 3, 2020
KC HRW Wheat excessive bearish movement
August 11, 2020
KC HRW Wheat excessive bearish movement
January 1, 2020

Comments are closed.

Lean Hogs excessive bearish movement Important price line breached by Merck & Co. Inc.

Futures Statistical Analysis – TD

Soybean Oil excessive bearish movement

March 9, 2021 11:16 am | By Autochartist

Soybean Oil experienced a 19.04% bullish movement in the last... Read more →

Corn excessive bearish movement

March 8, 2021 11:19 am | By Autochartist

Corn experienced a 4.61% bullish movement in the last 73... Read more →

Gold Front Month excessive bearish movement

March 8, 2021 11:19 am | By Autochartist

Gold Front Month experienced a 6.29% bearish movement in the... Read more →

Light Sweet Crude Oil Front Month excessive bearish movement

March 8, 2021 11:19 am | By Autochartist

Light Sweet Crude Oil Front Month experienced a 8.6% bullish... Read more →

US T-Bond excessive bearish movement

March 8, 2021 11:19 am | By Autochartist

US T-Bond experienced a 7.75% bearish movement in the last... Read more →

  • About Us
  • Privacy Policy
  • Disclaimer
  • Terms and Conditions
  • Get started for FREE
  • Contact Us
Copyright © 2022 Autochartist.com. All rights reserved.
This site uses cookies: Find out more.