Help & Documentation
  • Home
  • Sign In
  • Contact Us
  • Home
  • Sign In
  • Contact Us

Corn excessive bearish movement

/Futures Statistical Analysis - TD/Corn excessive bearish movement

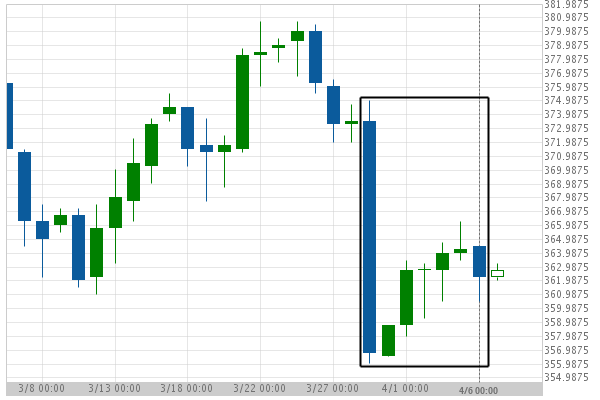
Corn excessive bearish movement

Posted on April 8, 2019 by Autochartist wrote in Futures Statistical Analysis - TD.

Corn experienced a 3.01% bearish movement in the last 8 days.

Tags: Big Movement, ZC
0 Likes
845 Views

You may also like

Soybeans excessive bullish movement
August 31, 2020
Light Sweet Crude Oil Front Month excessive bearish movement
October 18, 2018
US T-Bond excessive bearish movement
February 22, 2021

Comments are closed.

E-mini S&P 500 up to 2899.5000 Silver Front Month down to 15.0665

Futures Statistical Analysis – TD

Soybean Oil excessive bearish movement

March 9, 2021 11:16 am | By Autochartist

Soybean Oil experienced a 19.04% bullish movement in the last... Read more →

Corn excessive bearish movement

March 8, 2021 11:19 am | By Autochartist

Corn experienced a 4.61% bullish movement in the last 73... Read more →

Light Sweet Crude Oil Front Month excessive bearish movement

March 8, 2021 11:19 am | By Autochartist

Light Sweet Crude Oil Front Month experienced a 8.6% bullish... Read more →

Gold Front Month excessive bearish movement

March 8, 2021 11:19 am | By Autochartist

Gold Front Month experienced a 6.29% bearish movement in the... Read more →

10 year T-Note excessive bearish movement

March 8, 2021 11:19 am | By Autochartist

10 year T-Note experienced a 3.4% bearish movement in the... Read more →

  • About Us
  • Privacy Policy
  • Disclaimer
  • Terms and Conditions
  • Get started for FREE
  • Contact Us
Copyright © 2022 Autochartist.com. All rights reserved.
This site uses cookies: Find out more.