Help & Documentation
  • Home
  • Sign In
  • Contact Us
  • Home
  • Sign In
  • Contact Us

Corn down to 486.3358

/Futures Technical Analysis - TD/Corn down to 486.3358

Corn down to 486.3358

Posted on January 11, 2021 by admin wrote in Futures Technical Analysis - TD.

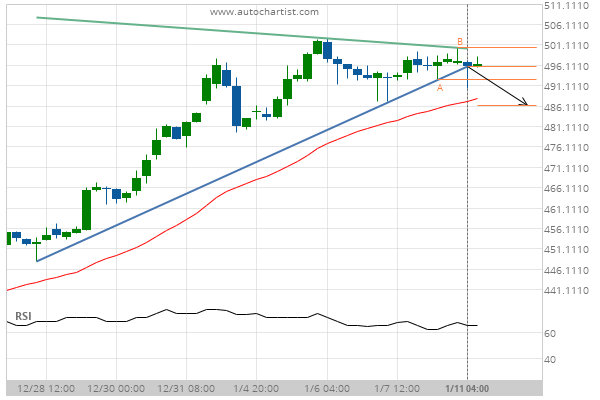
Triangle has broken through the support line at 11-Jan-2021 04:00 EST. Possible bearish price movement forecast for the next 2 days towards 486.3358.

Tags: CBOT, ZC
0 Likes
20 Views

You may also like

Soybeans down to 847.2500
August 6, 2019
Soybean Meal down to 293.3000
August 8, 2019
Light Sweet Crude Oil Front Month up to 61.2760
December 25, 2019

Comments are closed.

10 year T-Note down to 136.5313 Lean Hogs down to 65.7250

Futures Technical Analysis – TD

Soybean Oil up to 43.4600

January 22, 2021 11:15 am | By admin

Channel Up identified at 22-Jan-2021 02:30 EST. This pattern is... Read more →

Lean Hogs up to 72.0000

January 22, 2021 11:15 am | By admin

Channel Up identified at 20-Jan-2021 16:00 EST. This pattern is... Read more →

Light Sweet Crude Oil Front Month down to 51.1900

January 22, 2021 11:15 am | By admin

Broke through Support level of 52.1400 at 22-Jan-2021 06:00 EST Read more →

Gold Front Month down to 1831.8000

January 22, 2021 11:15 am | By admin

Broke through Support level of 1854.8000 at 22-Jan-2021 06:00 EST Read more →

US T-Bond down to 167.6322

January 22, 2021 11:15 am | By admin

Triangle has broken through the support line at 21-Jan-2021 12:00... Read more →

  • About Us
  • Privacy Policy
  • Disclaimer
  • Terms and Conditions
  • Get started for FREE
  • Contact Us
Copyright © 2020 Autochartist.com. All rights reserved.
This site uses cookies: Find out more.